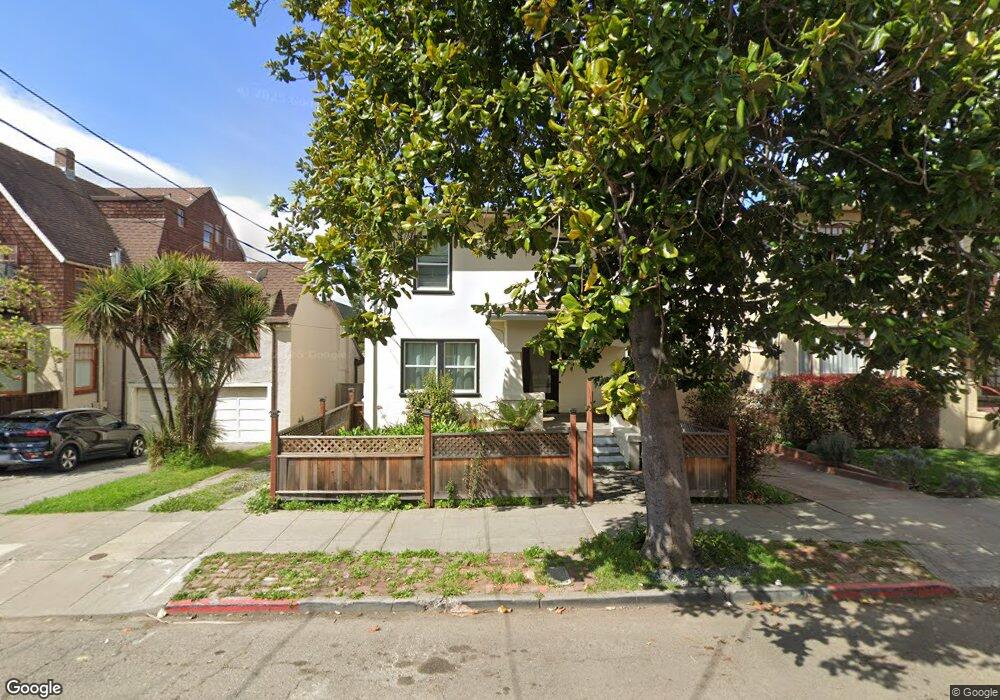
2646 Regent St Unit A Berkeley, CA 94704
Elmwood NeighborhoodEstimated Value: $701,000 - $1,217,883
4
Beds
3
Baths
1,679
Sq Ft
$618/Sq Ft
Est. Value
About This Home
This home is located at 2646 Regent St Unit A, Berkeley, CA 94704 and is currently estimated at $1,037,221, approximately $617 per square foot. 2646 Regent St Unit A is a home located in Alameda County with nearby schools including Emerson Elementary School, John Muir Elementary School, and Malcolm X Elementary School.
Ownership History
Date
Name
Owned For
Owner Type
Purchase Details
Closed on
Aug 2, 2021
Sold by
Maclay Wenxia W
Bought by
Maclay Wenxia W and Maclay Wenxia W
Current Estimated Value
Home Financials for this Owner
Home Financials are based on the most recent Mortgage that was taken out on this home.
Original Mortgage
$420,600
Outstanding Balance
$381,879
Interest Rate
2.8%
Mortgage Type
New Conventional
Estimated Equity
$655,342
Purchase Details
Closed on
Oct 18, 2018
Sold by
Maclay Wenxia W
Bought by
Maclay Wenxia W and The Wenxia W Maclay Revocable
Purchase Details
Closed on
Nov 14, 2017
Sold by
Maclay William Richard
Bought by
Maclay Wenxia W
Purchase Details
Closed on
Aug 3, 1998
Sold by
Cox Melvin R
Bought by
Soares Valerie and Rabinowitz David
Home Financials for this Owner
Home Financials are based on the most recent Mortgage that was taken out on this home.
Original Mortgage
$240,000
Interest Rate
6.88%
Create a Home Valuation Report for This Property
The Home Valuation Report is an in-depth analysis detailing your home's value as well as a comparison with similar homes in the area
Home Values in the Area
Average Home Value in this Area
Purchase History
| Date | Buyer | Sale Price | Title Company |
|---|---|---|---|
| Maclay Wenxia W | -- | Amrock Llc | |
| Maclay Wenxia W | -- | Amrock Llc | |
| Maclay Wenxia W | -- | None Available | |
| Maclay Wenxia W | -- | Chicago Title Company | |
| Soares Valerie | $325,000 | First American Title Guarant |
Source: Public Records
Mortgage History
| Date | Status | Borrower | Loan Amount |
|---|---|---|---|
| Open | Maclay Wenxia W | $420,600 | |
| Closed | Soares Valerie | $240,000 |
Source: Public Records
Tax History
| Year | Tax Paid | Tax Assessment Tax Assessment Total Assessment is a certain percentage of the fair market value that is determined by local assessors to be the total taxable value of land and additions on the property. | Land | Improvement |
|---|---|---|---|---|
| 2025 | $15,245 | $1,040,761 | $256,007 | $784,754 |
| 2024 | $15,245 | $1,020,353 | $250,987 | $769,366 |
| 2023 | $14,938 | $1,000,349 | $246,066 | $754,283 |
| 2022 | $14,689 | $980,737 | $241,242 | $739,495 |
| 2021 | $14,738 | $961,511 | $236,513 | $724,998 |
| 2020 | $13,988 | $951,660 | $234,090 | $717,570 |
| 2019 | $13,484 | $933,000 | $229,500 | $703,500 |
| 2018 | $13,296 | $900,000 | $225,000 | $675,000 |
| 2017 | $6,775 | $438,993 | $131,022 | $307,971 |
| 2016 | $6,547 | $430,387 | $128,454 | $301,933 |
| 2015 | $6,459 | $423,922 | $126,524 | $297,398 |
| 2014 | $6,412 | $415,619 | $124,046 | $291,573 |
Source: Public Records
Map
Nearby Homes
- 2535 Chilton Way
- 2702 Dana St
- 2550 Dana St Unit 2F
- 2509 Dwight Way
- 2319 Ward St
- 2601 College Ave Unit 203
- 2601 College Ave Unit 208
- 2643 Stuart St
- 2917 Telegraph Ave
- 2632 Warring St Unit 2
- 2614 Warring St Unit 6A
- 2935 Florence St
- 2817 Palm Ct
- 2243 Ashby Ave
- 2923 Wheeler St
- 2962 Piedmont Ave
- 2477 Prince St
- 2018 Blake St
- 3046 Deakin St
- 2 Panoramic Way Unit 105
- 2646 Regent St
- 2646 Regent St Unit B
- 2640 Regent St
- 2636 Regent St
- 2638 Regent St Unit 4
- 2642 Regent St Unit 1
- 2447 Derby St
- 2445 Derby St
- 2443 Derby St
- 2550 Regent St Unit 1
- 2626 Regent St
- 2647 Regent St
- 2444 Carleton St Unit 2
- 2444 Carleton St
- 2633 Regent St
- 2639 Regent St
- 2624 Regent St Unit A
- 2624 Regent St
- 2505 Derby St
- 2622 Regent St
Your Personal Tour Guide
Ask me questions while you tour the home.