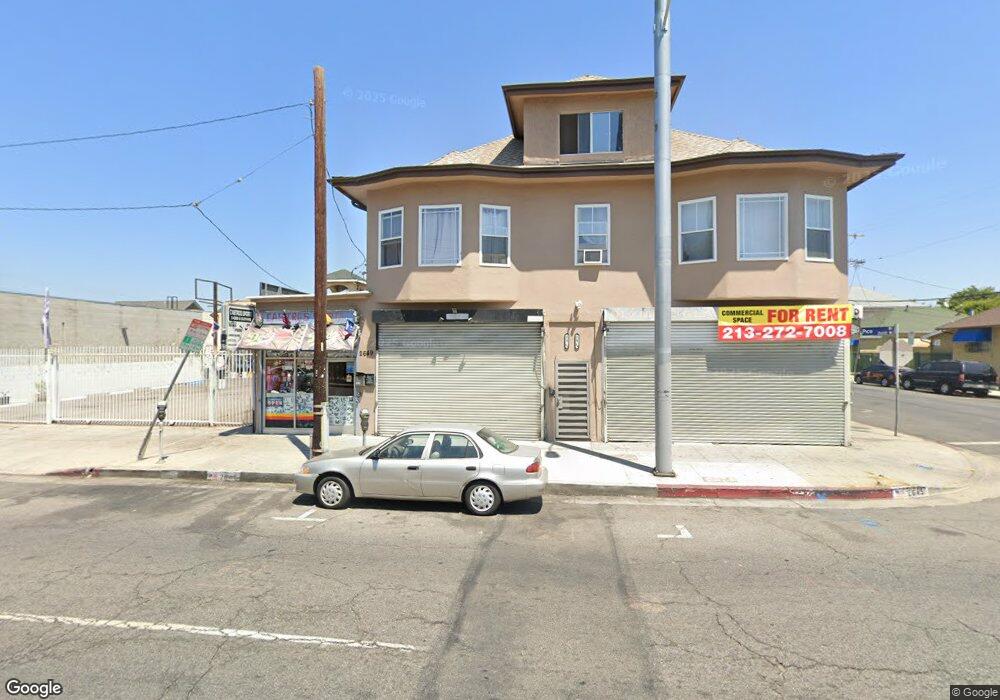
2647 W Pico Blvd Los Angeles, CA 90006
Pico-Union NeighborhoodEstimated Value: $1,433,712
--
Bed
--
Bath
6,090
Sq Ft
$235/Sq Ft
Est. Value
About This Home
This home is located at 2647 W Pico Blvd, Los Angeles, CA 90006 and is currently estimated at $1,433,712, approximately $235 per square foot. 2647 W Pico Blvd is a home located in Los Angeles County with nearby schools including Los Angeles Elementary School, Berendo Middle, and West Adams Preparatory High School.
Ownership History
Date
Name
Owned For
Owner Type
Purchase Details
Closed on
Jan 10, 2013
Sold by
Kermani Faramarz Shokrian
Bought by
Shokrian Mishel and Kermani Faramarz Shokrian
Current Estimated Value
Home Financials for this Owner
Home Financials are based on the most recent Mortgage that was taken out on this home.
Original Mortgage
$250,000
Interest Rate
3.31%
Mortgage Type
Commercial
Purchase Details
Closed on
Oct 20, 2005
Sold by
Shokrian Mishel
Bought by
Shokrian Mishel and 2005 Mishel Shokrian Revocable Trust
Purchase Details
Closed on
Aug 8, 2000
Sold by
Carsten Co Llc and Hino 8 Llc
Bought by
Kermani Faramarz Shokrian
Home Financials for this Owner
Home Financials are based on the most recent Mortgage that was taken out on this home.
Original Mortgage
$210,000
Interest Rate
7.89%
Mortgage Type
Commercial
Purchase Details
Closed on
Jun 25, 1996
Sold by
Wilshire State Bank
Bought by
Carsten Co Llc and Hino Llc
Create a Home Valuation Report for This Property
The Home Valuation Report is an in-depth analysis detailing your home's value as well as a comparison with similar homes in the area
Home Values in the Area
Average Home Value in this Area
Purchase History
| Date | Buyer | Sale Price | Title Company |
|---|---|---|---|
| Shokrian Mishel | -- | Lawyers Title Co | |
| Shokrian Mishel | -- | -- | |
| Kermani Faramarz Shokrian | -- | -- | |
| Kermani Faramarz Shokrian | $340,000 | Fidelity National Title Co | |
| Carsten Co Llc | -- | Stewart Title |
Source: Public Records
Mortgage History
| Date | Status | Borrower | Loan Amount |
|---|---|---|---|
| Closed | Shokrian Mishel | $250,000 | |
| Previous Owner | Kermani Faramarz Shokrian | $210,000 |
Source: Public Records
Tax History Compared to Growth
Tax History
| Year | Tax Paid | Tax Assessment Tax Assessment Total Assessment is a certain percentage of the fair market value that is determined by local assessors to be the total taxable value of land and additions on the property. | Land | Improvement |
|---|---|---|---|---|
| 2025 | $7,602 | $512,305 | $286,290 | $226,015 |
| 2024 | $7,602 | $502,261 | $280,677 | $221,584 |
| 2023 | $7,483 | $492,414 | $275,174 | $217,240 |
| 2022 | $7,164 | $482,760 | $269,779 | $212,981 |
| 2021 | $7,026 | $473,295 | $264,490 | $208,805 |
| 2019 | $6,839 | $459,258 | $256,646 | $202,612 |
| 2018 | $6,641 | $450,254 | $251,614 | $198,640 |
| 2016 | $6,190 | $432,773 | $241,845 | $190,928 |
| 2015 | $6,112 | $426,274 | $238,213 | $188,061 |
| 2014 | $6,149 | $417,925 | $233,547 | $184,378 |
Source: Public Records
Map
Nearby Homes
- 1311 Dewey Ave
- 1243 S Catalina St
- 2709 W Pico Blvd
- 1242 Fedora St
- 1207 S Catalina St
- 1233 Fedora St
- 1215 Fedora St
- 1153 S Kenmore Ave
- 1147 S Kenmore Ave
- 957 Arapanhoe
- 1146 S Berendo St
- 1147 Fedora St
- 1125 S Kenmore Ave
- 1424 S New Hampshire Ave
- 1147 S Mariposa Ave
- 1225 S Normandie Ave
- 1046 S Kenmore Ave
- 1043 S Kenmore Ave Unit 201
- 1038 Dewey Ave
- 1106 S New Hampshire Ave
- 1241 Dewey Ave Unit 4
- 1241 Dewey Ave Unit 1
- 1241 Dewey Ave Unit 3
- 1241 Dewey Ave Unit 2
- 1241 Dewey Ave Unit 6
- 1241 Dewey Ave Unit 5
- 1241 Dewey Ave
- 2632 W Pico Blvd
- 1237 Dewey Ave
- 1311 1/2 Dewey Ave
- 1242 Dewey Ave
- 1242 S Kenmore Ave
- 2624 W Pico Blvd
- 1238 Dewey Ave
- 1238 S Kenmore Ave
- 1234 Dewey Ave
- 1314 Dewey Ave
- 1243 S Catalina St Unit 1243
- 1243 S Catalina St Unit 1245
- 1243 S Catalina St Unit 1245 1/2