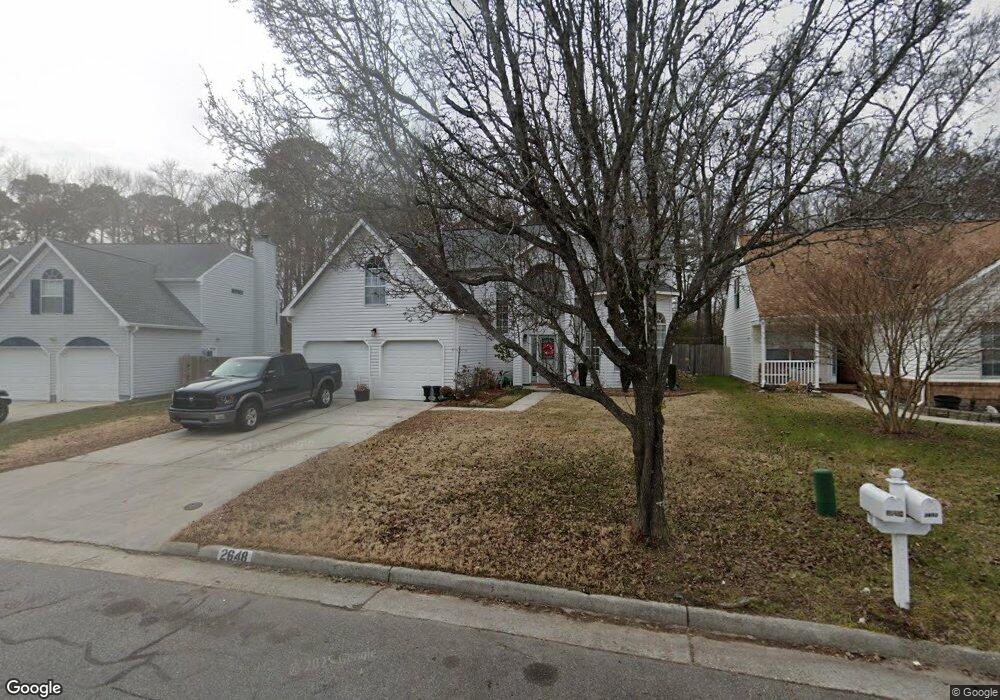
2648 Mulberry Loop Virginia Beach, VA 23456
Dam Neck NeighborhoodEstimated Value: $603,000 - $637,000
4
Beds
3
Baths
2,650
Sq Ft
$235/Sq Ft
Est. Value
About This Home
This home is located at 2648 Mulberry Loop, Virginia Beach, VA 23456 and is currently estimated at $622,080, approximately $234 per square foot. 2648 Mulberry Loop is a home located in Virginia Beach City with nearby schools including Strawbridge Elementary School, Corporate Landing Middle School, and Landstown High School.
Ownership History
Date
Name
Owned For
Owner Type
Purchase Details
Closed on
Jan 30, 2020
Sold by
Dietz Jeffrey A and Dietz Karla J
Bought by
Thompson Lajshon R and Thompson Guadalupe
Current Estimated Value
Home Financials for this Owner
Home Financials are based on the most recent Mortgage that was taken out on this home.
Original Mortgage
$424,545
Outstanding Balance
$376,617
Interest Rate
3.7%
Mortgage Type
VA
Estimated Equity
$245,463
Purchase Details
Closed on
Nov 14, 2007
Sold by
Dwight Richard H
Bought by
Dietz Jeffrey A
Home Financials for this Owner
Home Financials are based on the most recent Mortgage that was taken out on this home.
Original Mortgage
$342,000
Interest Rate
6.48%
Mortgage Type
New Conventional
Purchase Details
Closed on
Jun 28, 1999
Sold by
Affordable Homes L L C 1
Bought by
Dwight Richard H
Home Financials for this Owner
Home Financials are based on the most recent Mortgage that was taken out on this home.
Original Mortgage
$130,000
Interest Rate
7.39%
Create a Home Valuation Report for This Property
The Home Valuation Report is an in-depth analysis detailing your home's value as well as a comparison with similar homes in the area
Home Values in the Area
Average Home Value in this Area
Purchase History
| Date | Buyer | Sale Price | Title Company |
|---|---|---|---|
| Thompson Lajshon R | $415,000 | Attorney | |
| Dietz Jeffrey A | $360,000 | -- | |
| Dwight Richard H | $17,000 | -- |
Source: Public Records
Mortgage History
| Date | Status | Borrower | Loan Amount |
|---|---|---|---|
| Open | Thompson Lajshon R | $424,545 | |
| Previous Owner | Dietz Jeffrey A | $342,000 | |
| Previous Owner | Dwight Richard H | $130,000 |
Source: Public Records
Tax History
| Year | Tax Paid | Tax Assessment Tax Assessment Total Assessment is a certain percentage of the fair market value that is determined by local assessors to be the total taxable value of land and additions on the property. | Land | Improvement |
|---|---|---|---|---|
| 2025 | $5,115 | $545,300 | $195,000 | $350,300 |
| 2024 | $5,115 | $527,300 | $195,000 | $332,300 |
| 2023 | $4,866 | $491,500 | $180,000 | $311,500 |
| 2022 | $4,507 | $455,300 | $146,000 | $309,300 |
| 2021 | $4,117 | $415,900 | $133,000 | $282,900 |
| 2020 | $3,928 | $386,000 | $126,000 | $260,000 |
| 2019 | $3,863 | $369,200 | $117,000 | $252,200 |
| 2018 | $3,701 | $369,200 | $117,000 | $252,200 |
| 2017 | $3,584 | $357,500 | $112,500 | $245,000 |
| 2016 | $3,469 | $350,400 | $112,500 | $237,900 |
| 2015 | $3,579 | $361,500 | $116,400 | $245,100 |
| 2014 | $2,933 | $342,200 | $116,400 | $225,800 |
Source: Public Records
Map
Nearby Homes
- 1801 Winter Park Ct
- 1905 Olympic Dr
- 2548 Farmworth Trail
- 1869 Somersby Ln
- 1725 Star Lake Dr
- 1892 Somersby Ln
- 2736 Springhaven Dr
- 2633 Au Sable Place
- 1841 Kensal Green Dr
- 2540 Windy Pines Bend
- 2485 Windy Pines Bend
- 2817 Saville Garden Way
- 2937 Mimosa Ct
- 2404 Belle Ct
- 1946 Cranborne Ct
- 2977 Saville Garden Way
- 1700 Mayberry Dr
- 2304 Apple Tree Crescent
- 2689 Pleasant Acres Dr
- 2308 Holland Rd
- 2652 Mulberry Loop
- 2644 Mulberry Loop
- 2656 Mulberry Loop
- 2640 Mulberry Loop
- 2660 Mulberry Loop
- 2636 Mulberry Loop
- 2645 Mulberry Loop
- 2649 Mulberry Loop
- 2664 Mulberry Loop
- 2653 Mulberry Loop
- 2657 Mulberry Loop
- 2632 Mulberry Loop
- 2637 Mulberry Loop
- 2665 Mulberry Loop
- 2668 Mulberry Loop
- 2633 Mulberry Loop
- 2628 Mulberry Loop
- 2681 Mulberry Loop
- 2629 Mulberry Loop
- 2501 Decathlon Crescent
Your Personal Tour Guide
Ask me questions while you tour the home.