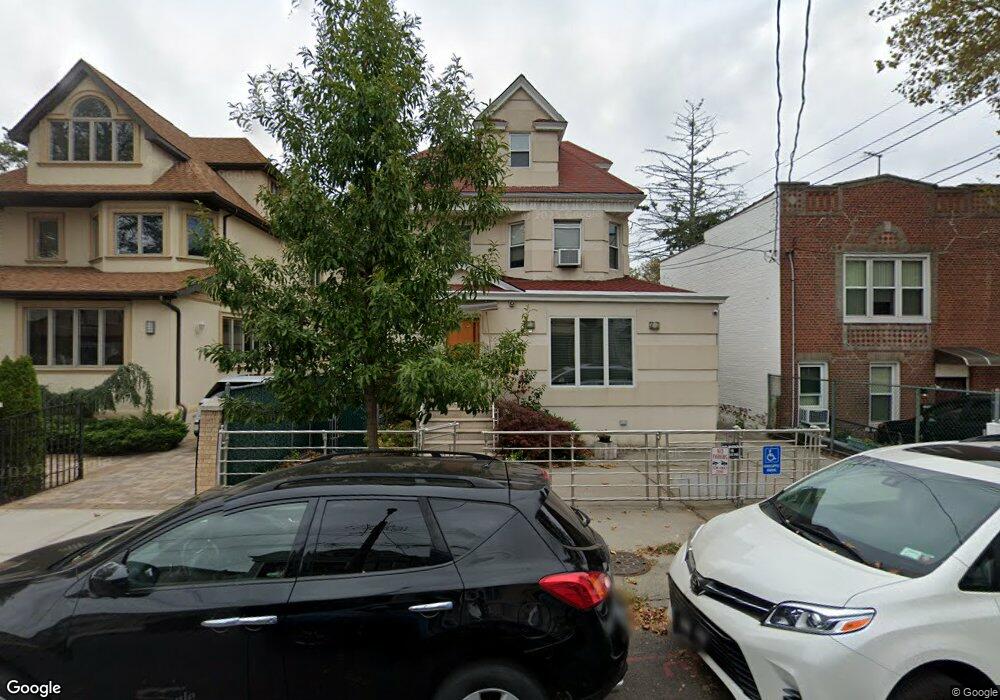
2649 E 27th St Unit 2 Brooklyn, NY 11235
Sheepshead Bay NeighborhoodEstimated Value: $1,277,000 - $1,516,000
2
Beds
3
Baths
2,501
Sq Ft
$563/Sq Ft
Est. Value
About This Home
This home is located at 2649 E 27th St Unit 2, Brooklyn, NY 11235 and is currently estimated at $1,408,076, approximately $563 per square foot. 2649 E 27th St Unit 2 is a home located in Kings County with nearby schools including P.S. 52 Sheepshead Bay, Jhs 14 Shell Bank, and St Mark School.
Ownership History
Date
Name
Owned For
Owner Type
Purchase Details
Closed on
Jul 23, 2014
Sold by
Rozenbaum Aleksandr
Bought by
Krichevsky Vladimir
Current Estimated Value
Home Financials for this Owner
Home Financials are based on the most recent Mortgage that was taken out on this home.
Original Mortgage
$66,500,000
Outstanding Balance
$50,466,897
Interest Rate
4.14%
Mortgage Type
Purchase Money Mortgage
Estimated Equity
-$49,058,821
Purchase Details
Closed on
Jan 30, 2002
Sold by
Zoloto Mikhail
Bought by
Rozenbaum Aleksandr and Rozen Baum
Home Financials for this Owner
Home Financials are based on the most recent Mortgage that was taken out on this home.
Original Mortgage
$384,900
Interest Rate
7.01%
Purchase Details
Closed on
Apr 18, 1994
Sold by
Hollenberg Reidun
Bought by
Zoloto Mikhail and Zoloto Margarita
Create a Home Valuation Report for This Property
The Home Valuation Report is an in-depth analysis detailing your home's value as well as a comparison with similar homes in the area
Home Values in the Area
Average Home Value in this Area
Purchase History
| Date | Buyer | Sale Price | Title Company |
|---|---|---|---|
| Krichevsky Vladimir | $950,000 | -- | |
| Rozenbaum Aleksandr | -- | -- | |
| Zoloto Mikhail | $200,000 | -- |
Source: Public Records
Mortgage History
| Date | Status | Borrower | Loan Amount |
|---|---|---|---|
| Open | Krichevsky Vladimir | $66,500,000 | |
| Previous Owner | Rozenbaum Aleksandr | $67,100 | |
| Previous Owner | Rozenbaum Aleksandr | $384,900 |
Source: Public Records
Tax History
| Year | Tax Paid | Tax Assessment Tax Assessment Total Assessment is a certain percentage of the fair market value that is determined by local assessors to be the total taxable value of land and additions on the property. | Land | Improvement |
|---|---|---|---|---|
| 2025 | $8,857 | $90,300 | $15,420 | $74,880 |
| 2024 | $8,857 | $71,340 | $15,420 | $55,920 |
| 2023 | $8,449 | $79,260 | $15,420 | $63,840 |
| 2022 | $8,305 | $64,860 | $15,420 | $49,440 |
| 2021 | $8,689 | $71,160 | $15,420 | $55,740 |
| 2020 | $4,075 | $59,460 | $15,420 | $44,040 |
| 2019 | $7,687 | $58,980 | $15,420 | $43,560 |
| 2018 | $7,067 | $34,669 | $9,706 | $24,963 |
| 2017 | $5,562 | $34,669 | $9,320 | $25,349 |
| 2016 | $6,569 | $34,408 | $11,012 | $23,396 |
| 2015 | $3,725 | $32,461 | $15,439 | $17,022 |
| 2014 | $3,725 | $30,624 | $14,566 | $16,058 |
Source: Public Records
Map
Nearby Homes
- 2678 E 28th St
- 2644 E 27th St
- 2652 E 29th St
- 2601 E 26th St Unit 1A
- 2711 E 26th St
- 2724 E 27th St
- 4641 Bedford Ave Unit 2B
- 2726 E 27th St
- 2906 Voorhies Ave
- 2733 E 27th St
- 4709 Bedford Ave
- 2719 E 28th St Unit 3F
- 2717 E 28th St Unit 4E
- 3903 Nostrand Ave Unit 3J
- 3903 Nostrand Ave Unit 6D
- 2752 E 27th St Unit A3
- 3909 Nostrand Ave Unit 2C
- 2747 E 26th St Unit 101
- 2679 E 24th St Unit 1B
- 3901 Nostrand Ave Unit 3T
Your Personal Tour Guide
Ask me questions while you tour the home.