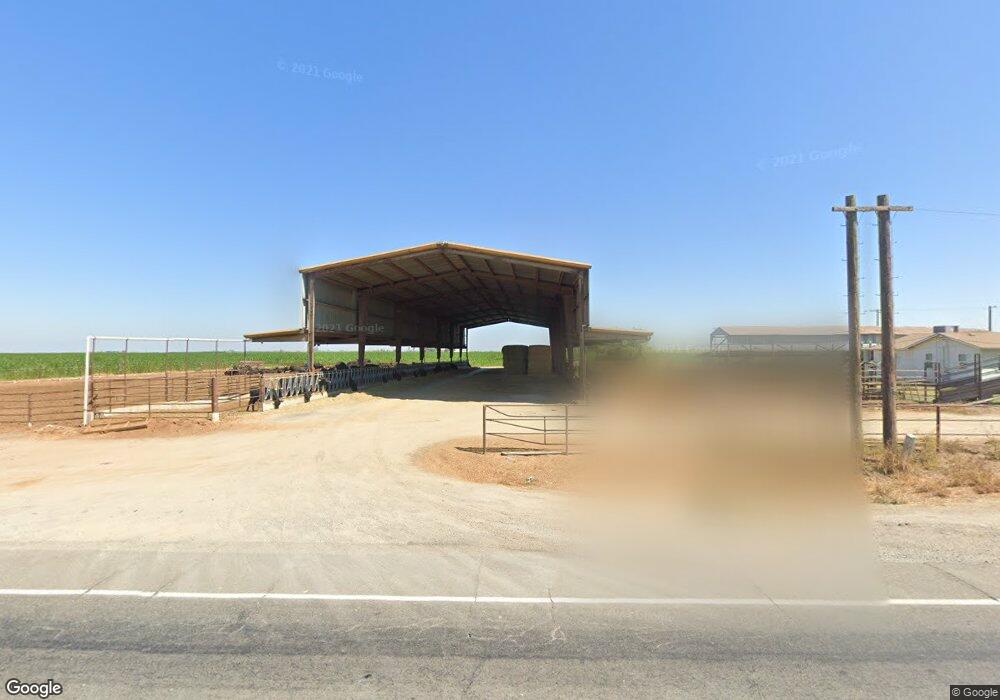
2649 W Main Ave Crows Landing, CA 95313
Estimated Value: $329,000 - $1,990,866
3
Beds
1
Bath
947
Sq Ft
$1,225/Sq Ft
Est. Value
About This Home
This home is located at 2649 W Main Ave, Crows Landing, CA 95313 and is currently estimated at $1,159,933, approximately $1,224 per square foot. 2649 W Main Ave is a home located in Stanislaus County with nearby schools including Chatom Elementary School, Mountain View Middle School, and Marvin A. Dutcher Middle School.
Ownership History
Date
Name
Owned For
Owner Type
Purchase Details
Closed on
Jan 7, 2008
Sold by
Soares Duarte A
Bought by
Morris Tony and Morris Delfina R
Current Estimated Value
Purchase Details
Closed on
Nov 7, 2007
Sold by
Watson Patricia Lou Ann
Bought by
Morris Tony J and Morris Delfina R
Create a Home Valuation Report for This Property
The Home Valuation Report is an in-depth analysis detailing your home's value as well as a comparison with similar homes in the area
Purchase History
| Date | Buyer | Sale Price | Title Company |
|---|---|---|---|
| Morris Tony | $1,800,000 | Chicago Title Company | |
| Morris Tony J | -- | Alliance Title Company |
Source: Public Records
Tax History
| Year | Tax Paid | Tax Assessment Tax Assessment Total Assessment is a certain percentage of the fair market value that is determined by local assessors to be the total taxable value of land and additions on the property. | Land | Improvement |
|---|---|---|---|---|
| 2025 | $10,457 | $956,228 | $859,692 | $96,536 |
| 2024 | $10,214 | $937,480 | $842,836 | $94,644 |
| 2023 | $10,228 | $919,099 | $826,310 | $92,789 |
| 2022 | $10,088 | $901,078 | $810,108 | $90,970 |
| 2021 | $9,935 | $883,411 | $794,224 | $89,187 |
| 2020 | $9,697 | $874,354 | $786,081 | $88,273 |
| 2019 | $10,053 | $857,211 | $770,668 | $86,543 |
| 2018 | $10,046 | $840,404 | $755,557 | $84,847 |
| 2017 | $9,741 | $823,927 | $740,743 | $83,184 |
| 2016 | $9,422 | $807,772 | $726,219 | $81,553 |
| 2015 | $9,378 | $795,639 | $715,311 | $80,328 |
| 2014 | $9,218 | $780,055 | $701,300 | $78,755 |
Source: Public Records
Map
Nearby Homes
- 16642 Hickory Ave
- 1613 Fig Ave
- 1290 Orange Ave
- 1407 E Las Palmas Ave
- 16012 Sycamore Ave
- 1137 Apricot Ave
- 13807 Carpenter Rd
- 518 Bedfordshire Dr
- 526 Bedfordshire Dr
- 18413 Sycamore Ave
- 918 Cumbria Ln
- 1237 W Keyes Rd
- 804 Wissett Place
- 617 Mansfield Dr
- 1424 Eucalyptus Ave
- 805 Wissett Place
- 809 Wissett Place
- 924 Zennor Place
- 905 Zennor Place
- 909 Zennor Place
Your Personal Tour Guide
Ask me questions while you tour the home.