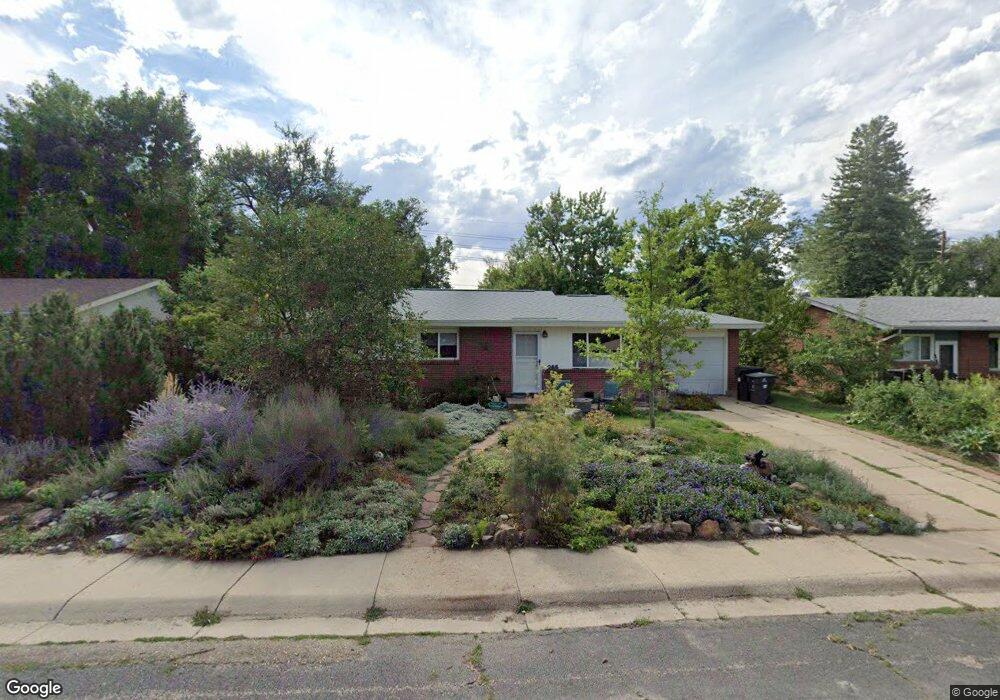
265 32nd St Boulder, CO 80305
South Boulder NeighborhoodEstimated Value: $683,989 - $805,000
3
Beds
1
Bath
1,040
Sq Ft
$722/Sq Ft
Est. Value
About This Home
This home is located at 265 32nd St, Boulder, CO 80305 and is currently estimated at $750,747, approximately $721 per square foot. 265 32nd St is a home located in Boulder County with nearby schools including Creekside Elementary School, Manhattan Middle School of the Arts & Academics, and Fairview High School.
Ownership History
Date
Name
Owned For
Owner Type
Purchase Details
Closed on
Dec 8, 1997
Sold by
Goodwin Philip H
Bought by
Inoshita Carolyn K
Current Estimated Value
Home Financials for this Owner
Home Financials are based on the most recent Mortgage that was taken out on this home.
Original Mortgage
$153,000
Outstanding Balance
$26,045
Interest Rate
7.3%
Estimated Equity
$724,702
Purchase Details
Closed on
Feb 8, 1995
Sold by
Buchanan Carl Lawrence
Bought by
Goodwin Philip H
Home Financials for this Owner
Home Financials are based on the most recent Mortgage that was taken out on this home.
Original Mortgage
$103,000
Interest Rate
6.87%
Purchase Details
Closed on
Nov 15, 1984
Bought by
Inoshita Carolyn K and Goldstein Jeffrey D
Create a Home Valuation Report for This Property
The Home Valuation Report is an in-depth analysis detailing your home's value as well as a comparison with similar homes in the area
Home Values in the Area
Average Home Value in this Area
Purchase History
| Date | Buyer | Sale Price | Title Company |
|---|---|---|---|
| Inoshita Carolyn K | $180,000 | -- | |
| Goodwin Philip H | $140,500 | -- | |
| Inoshita Carolyn K | -- | -- |
Source: Public Records
Mortgage History
| Date | Status | Borrower | Loan Amount |
|---|---|---|---|
| Open | Inoshita Carolyn K | $153,000 | |
| Previous Owner | Goodwin Philip H | $103,000 |
Source: Public Records
Tax History Compared to Growth
Tax History
| Year | Tax Paid | Tax Assessment Tax Assessment Total Assessment is a certain percentage of the fair market value that is determined by local assessors to be the total taxable value of land and additions on the property. | Land | Improvement |
|---|---|---|---|---|
| 2025 | $4,162 | $47,462 | $28,981 | $18,481 |
| 2024 | $4,162 | $47,462 | $28,981 | $18,481 |
| 2023 | $4,090 | $47,362 | $34,096 | $16,951 |
| 2022 | $3,685 | $39,684 | $25,819 | $13,865 |
| 2021 | $3,514 | $40,826 | $26,562 | $14,264 |
| 2020 | $3,323 | $38,181 | $25,597 | $12,584 |
| 2019 | $3,273 | $38,181 | $25,597 | $12,584 |
| 2018 | $3,058 | $35,273 | $23,544 | $11,729 |
| 2017 | $2,962 | $38,996 | $26,029 | $12,967 |
| 2016 | $2,759 | $31,872 | $16,398 | $15,474 |
| 2015 | $2,613 | $26,579 | $13,612 | $12,967 |
| 2014 | $2,235 | $26,579 | $13,612 | $12,967 |
Source: Public Records
Map
Nearby Homes
- 3410 Ash Ave
- 385 32nd St
- 340 29th St
- 140 S Lashley Ln
- 325 27th St
- 2877 Moorhead Ave
- 3682 Chase Ct
- 2250 Bluebell Ave
- 325 Fox Ct
- 2955 Stanford Ave
- 805 29th St Unit 253
- 805 29th St Unit 504
- 755 34th St
- 2585 Kohler Dr
- 245 Fair Place
- 419 22nd St
- 2119 Mariposa Ave
- 450 S 40th St
- 450 S 41st St
- 2003 Bluebell Ave