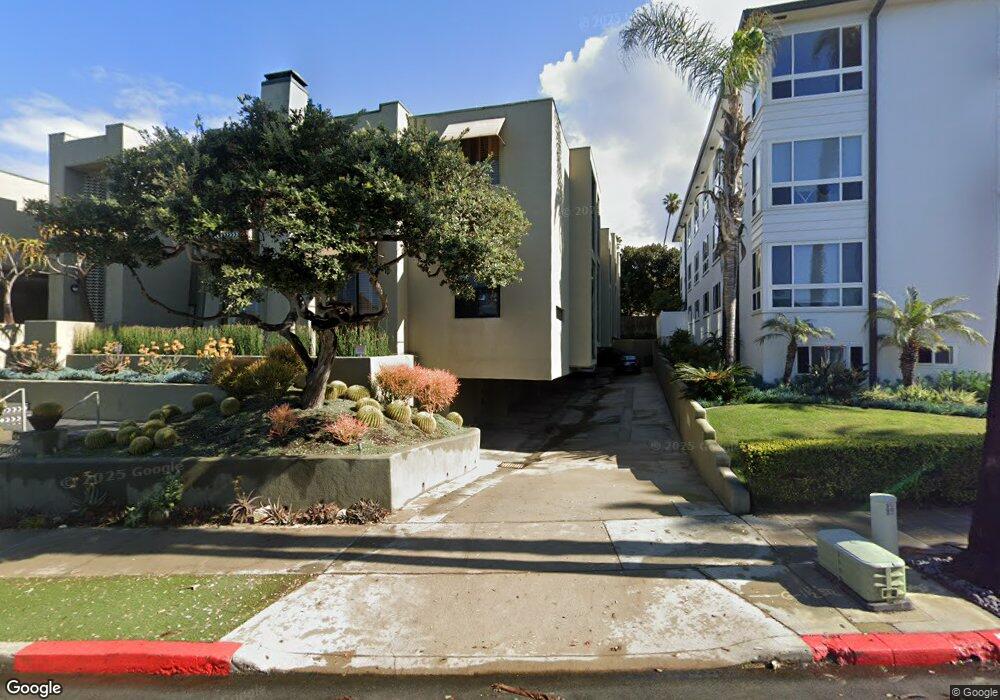
265 Coast Blvd Unit 3 La Jolla, CA 92037
The Village NeighborhoodEstimated Value: $1,940,193 - $3,309,000
2
Beds
3
Baths
1,673
Sq Ft
$1,412/Sq Ft
Est. Value
About This Home
This home is located at 265 Coast Blvd Unit 3, La Jolla, CA 92037 and is currently estimated at $2,361,548, approximately $1,411 per square foot. 265 Coast Blvd Unit 3 is a home located in San Diego County with nearby schools including La Jolla Elementary School, Muirlands Middle School, and La Jolla High School.
Ownership History
Date
Name
Owned For
Owner Type
Purchase Details
Closed on
Jul 31, 2013
Sold by
Mosier Glenn A and Mosier Glenn
Bought by
Mosier Glenn A and Mosier Linda K
Current Estimated Value
Purchase Details
Closed on
Feb 23, 2001
Sold by
Crochet Robert J and Crochet Nina C
Bought by
Mosier Glenn
Home Financials for this Owner
Home Financials are based on the most recent Mortgage that was taken out on this home.
Original Mortgage
$710,400
Outstanding Balance
$277,976
Interest Rate
8.02%
Estimated Equity
$2,083,572
Purchase Details
Closed on
Mar 6, 1998
Sold by
Crochet Robert J and Crochet Nina
Bought by
Crochet Robert J and Crochet Nina C
Purchase Details
Closed on
Dec 3, 1997
Sold by
Lee Susan R 1995 California Revocable and Ray Susan
Bought by
Crochet Robert J and Crochet Nina
Home Financials for this Owner
Home Financials are based on the most recent Mortgage that was taken out on this home.
Original Mortgage
$288,800
Interest Rate
7.62%
Create a Home Valuation Report for This Property
The Home Valuation Report is an in-depth analysis detailing your home's value as well as a comparison with similar homes in the area
Home Values in the Area
Average Home Value in this Area
Purchase History
| Date | Buyer | Sale Price | Title Company |
|---|---|---|---|
| Mosier Glenn A | -- | None Available | |
| Mosier Glenn | $888,000 | Chicago Title Co | |
| Crochet Robert J | -- | Commonwealth Land Title Co | |
| Crochet Robert J | -- | Commonwealth Land Title Co |
Source: Public Records
Mortgage History
| Date | Status | Borrower | Loan Amount |
|---|---|---|---|
| Open | Mosier Glenn | $710,400 | |
| Previous Owner | Crochet Robert J | $288,800 |
Source: Public Records
Tax History Compared to Growth
Tax History
| Year | Tax Paid | Tax Assessment Tax Assessment Total Assessment is a certain percentage of the fair market value that is determined by local assessors to be the total taxable value of land and additions on the property. | Land | Improvement |
|---|---|---|---|---|
| 2025 | $16,056 | $1,338,058 | $1,054,784 | $283,274 |
| 2024 | $16,056 | $1,311,822 | $1,034,102 | $277,720 |
| 2023 | $15,701 | $1,286,101 | $1,013,826 | $272,275 |
| 2022 | $15,282 | $1,260,885 | $993,948 | $266,937 |
| 2021 | $15,176 | $1,236,162 | $974,459 | $261,703 |
| 2020 | $14,991 | $1,223,488 | $964,468 | $259,020 |
| 2019 | $14,722 | $1,199,499 | $945,557 | $253,942 |
| 2018 | $13,761 | $1,175,980 | $927,017 | $248,963 |
| 2017 | $13,433 | $1,152,923 | $908,841 | $244,082 |
| 2016 | $13,219 | $1,130,318 | $891,021 | $239,297 |
| 2015 | $13,023 | $1,113,341 | $877,638 | $235,703 |
| 2014 | $12,815 | $1,091,533 | $860,447 | $231,086 |
Source: Public Records
Map
Nearby Homes
- 230 Prospect St Unit 12
- 229 Coast Blvd Unit U1
- 202 Coast Blvd Unit 4
- 100 Coast Blvd Unit 101
- 220 Coast Blvd Unit 2M
- 265 Coast Blvd Unit 9
- 302 Prospect St Unit 7
- 302 Prospect St Unit 6
- 357 Coast Blvd S
- 7520 Draper Ave Unit 3
- 726 Silver St
- 708 Silver St
- 718 Silver St
- 346 Dunemere Dr
- 7635 Draper Ave Unit LU4
- 7560 Eads Ave Unit 12
- 609 Genter St
- 7601 Eads Ave
- 607 Arenas St
- 716 Glenview Ln
- 265 Coast Blvd
- 265 Coast Blvd Unit 10
- 265 Coast Blvd Unit 8
- 265 Coast Blvd Unit 7
- 265 Coast Blvd Unit 6
- 265 Coast Blvd Unit 5
- 265 Coast Blvd Unit 4
- 265 Coast Blvd Unit 2
- 265 Coast Blvd Unit 1
- 303 Coast Blvd
- 303 Coast Blvd Unit 9
- 303 Coast Blvd Unit 2
- 303 Coast Blvd Unit 1
- 303 Coast Blvd Unit 22
- 303 Coast Blvd Unit 17
- 303 Coast Blvd Unit 18
- 303 Coast Blvd Unit 3
- 303 Coast Blvd Unit 4
- 303 Coast Blvd Unit 5
- 303 Coast Blvd Unit 7