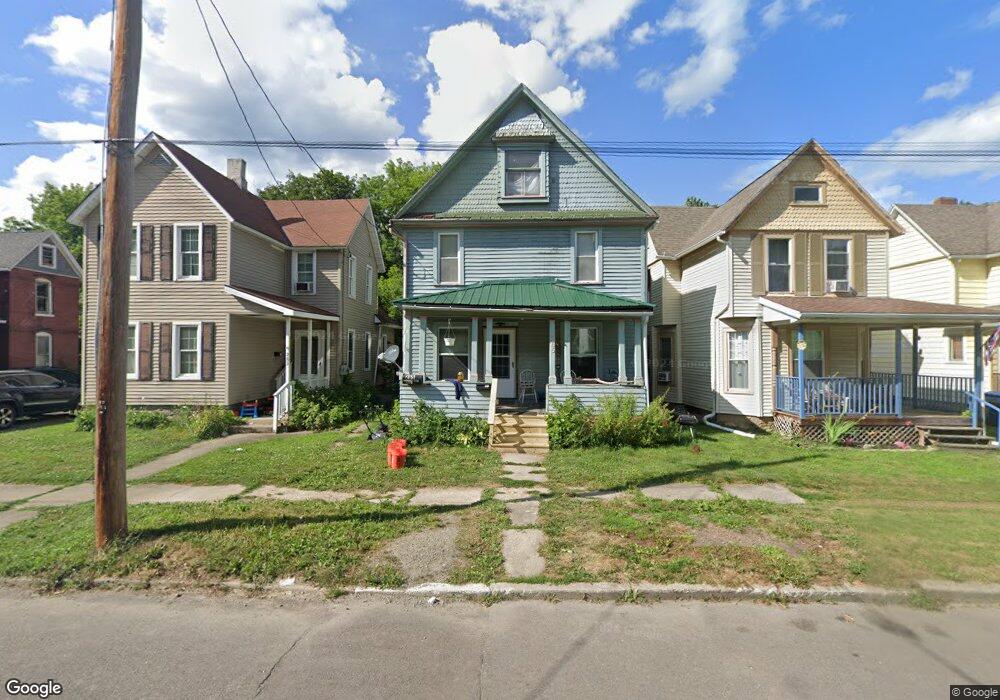
265 E 3rd St Corning, NY 14830
Estimated Value: $95,442 - $137,000
4
Beds
2
Baths
2,136
Sq Ft
$56/Sq Ft
Est. Value
About This Home
This home is located at 265 E 3rd St, Corning, NY 14830 and is currently estimated at $120,111, approximately $56 per square foot. 265 E 3rd St is a home located in Steuben County with nearby schools including William E. Severn Elementary School, Corning-Painted Post Middle School, and Corning-Painted Post High School.
Ownership History
Date
Name
Owned For
Owner Type
Purchase Details
Closed on
Feb 22, 2018
Sold by
Raner Darryl L and Raner Diane
Bought by
Raners Rentals Llc
Current Estimated Value
Purchase Details
Closed on
Mar 14, 2011
Sold by
Glosser Jesse T
Bought by
Raner Darryl L
Home Financials for this Owner
Home Financials are based on the most recent Mortgage that was taken out on this home.
Original Mortgage
$32,800
Interest Rate
4.83%
Mortgage Type
Purchase Money Mortgage
Create a Home Valuation Report for This Property
The Home Valuation Report is an in-depth analysis detailing your home's value as well as a comparison with similar homes in the area
Home Values in the Area
Average Home Value in this Area
Purchase History
| Date | Buyer | Sale Price | Title Company |
|---|---|---|---|
| Raners Rentals Llc | -- | -- | |
| Raner Darryl L | $41,000 | Robert H Plasker |
Source: Public Records
Mortgage History
| Date | Status | Borrower | Loan Amount |
|---|---|---|---|
| Previous Owner | Raner Darryl L | $32,800 |
Source: Public Records
Tax History
| Year | Tax Paid | Tax Assessment Tax Assessment Total Assessment is a certain percentage of the fair market value that is determined by local assessors to be the total taxable value of land and additions on the property. | Land | Improvement |
|---|---|---|---|---|
| 2024 | $2,334 | $85,000 | $7,300 | $77,700 |
| 2023 | $2,360 | $85,000 | $7,300 | $77,700 |
| 2022 | $3,528 | $75,000 | $6,300 | $68,700 |
| 2021 | $2,595 | $75,000 | $6,300 | $68,700 |
| 2020 | $1,625 | $75,000 | $6,300 | $68,700 |
| 2019 | $3,345 | $75,000 | $6,300 | $68,700 |
| 2018 | $3,345 | $75,000 | $6,300 | $68,700 |
| 2017 | $2,477 | $75,000 | $6,300 | $68,700 |
| 2016 | $2,449 | $75,000 | $6,300 | $68,700 |
| 2015 | -- | $75,000 | $6,300 | $68,700 |
| 2014 | -- | $75,000 | $6,300 | $68,700 |
Source: Public Records
Map
Nearby Homes
- 217 E 3rd St
- 290 Diatreta Ln
- 264 E 4th St
- 268-270 E 4th St
- 332 E 2nd St
- 190 E 3rd St
- 360 E 1st St
- 329 E Market Street Extension
- 326 Woodview Ave
- 335 E Market Street Extension
- 159 Watauga Ave
- 156 Watauga Ave
- 327 Woodview Ave
- 183-185 Wall St
- 199 Wall St
- 169 Wall St
- 87 E 2nd St
- 53 Mcmahon Ave
- 51 Mcmahon Ave
- 422 Watauga Ave
Your Personal Tour Guide
Ask me questions while you tour the home.