Estimated Value: $475,000 - $557,000
5
Beds
3
Baths
1,618
Sq Ft
$323/Sq Ft
Est. Value
About This Home
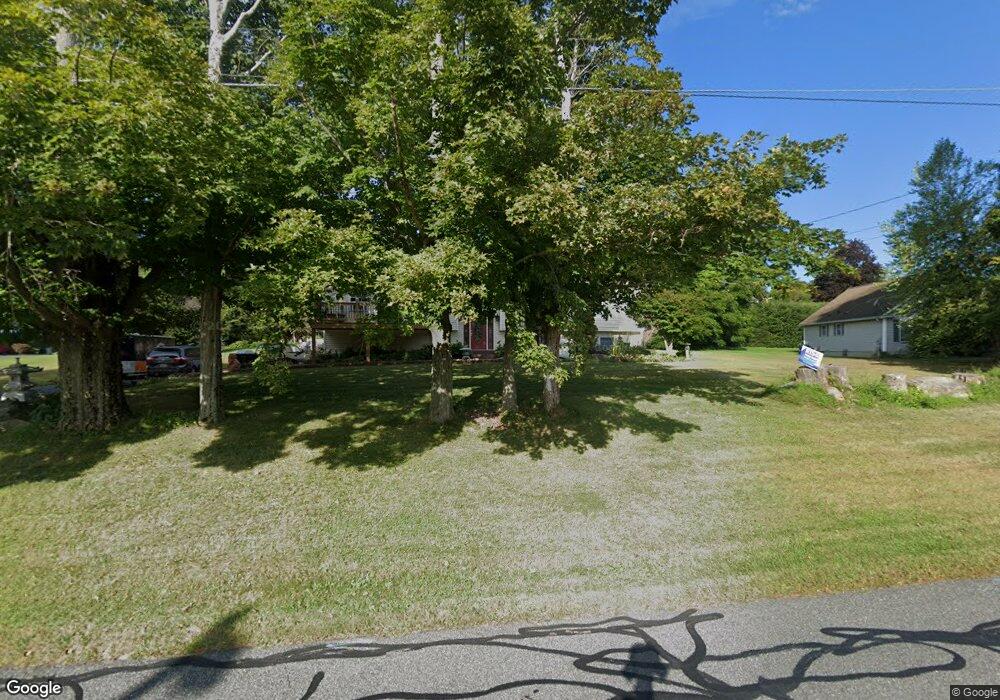
This home is located at 265 Greylock St, Lee, MA 01238 and is currently estimated at $523,004, approximately $323 per square foot. 265 Greylock St is a home located in Berkshire County with nearby schools including Lee Elementary School and Lee Middle/High School.
Ownership History
Date
Name
Owned For
Owner Type
Purchase Details
Closed on
Oct 21, 1999
Sold by
Fox Re Inc
Bought by
Csepes Peter and Tan-Csepes Sabrina
Current Estimated Value
Home Financials for this Owner
Home Financials are based on the most recent Mortgage that was taken out on this home.
Original Mortgage
$160,000
Outstanding Balance
$44,918
Interest Rate
7.83%
Mortgage Type
Purchase Money Mortgage
Estimated Equity
$478,086
Create a Home Valuation Report for This Property
The Home Valuation Report is an in-depth analysis detailing your home's value as well as a comparison with similar homes in the area
Home Values in the Area
Average Home Value in this Area
Purchase History
| Date | Buyer | Sale Price | Title Company |
|---|---|---|---|
| Csepes Peter | $50,000 | -- |
Source: Public Records
Mortgage History
| Date | Status | Borrower | Loan Amount |
|---|---|---|---|
| Open | Csepes Peter | $160,000 | |
| Closed | Csepes Peter | $10,000 |
Source: Public Records
Tax History
| Year | Tax Paid | Tax Assessment Tax Assessment Total Assessment is a certain percentage of the fair market value that is determined by local assessors to be the total taxable value of land and additions on the property. | Land | Improvement |
|---|---|---|---|---|
| 2025 | $5,516 | $490,300 | $111,900 | $378,400 |
| 2024 | $5,206 | $463,200 | $106,900 | $356,300 |
| 2023 | $4,872 | $411,800 | $102,700 | $309,100 |
| 2022 | $4,790 | $350,900 | $96,600 | $254,300 |
| 2021 | $4,690 | $319,500 | $87,100 | $232,400 |
| 2020 | $4,680 | $318,800 | $81,200 | $237,600 |
| 2019 | $4,743 | $320,900 | $83,300 | $237,600 |
| 2018 | $4,695 | $320,900 | $83,300 | $237,600 |
| 2017 | $4,578 | $311,000 | $71,100 | $239,900 |
| 2016 | $4,498 | $308,900 | $69,000 | $239,900 |
| 2015 | $4,349 | $308,900 | $69,000 | $239,900 |
| 2014 | $4,095 | $289,400 | $69,000 | $220,400 |
Source: Public Records
Map
Nearby Homes
- 160 High St
- 135 East St
- 205 High St
- 180 Center St
- 290 E Center St
- 131 Center St
- 0 East St Unit 235893
- 30 Pease Terrace
- 155 Laurel St
- 45 Forest St
- 2 Devon Rd
- 140 Theresa Terrace
- 184 Washington Mountain Rd
- 615 Laurel St
- 20 Forest St
- 528 Walker St
- 524 Walker St
- 289 Antelope Dr
- 500 Walker St
- 560 Stockbridge Rd
- 170 Orchard St
- 255 Greylock St
- 160 Orchard St
- 245 Greylock St
- 165 Orchard St
- 175 Orchard St
- 140 Orchard St
- 145 Orchard St
- 25 St Mary's Ave
- 25 Saint Marys Ave
- 130 Orchard St
- 5 Leonard Ave
- 35 Saint Mary's Ave
- 35 Saint Marys Ave
- 135 Orchard St
- 15 Leonard Ave
- 50 Saint Marys Ave
- 335 Greylock St
- 225 Greylock St
- 235 Greylock St
Your Personal Tour Guide
Ask me questions while you tour the home.