Estimated Value: $530,000 - $579,000
About This Home
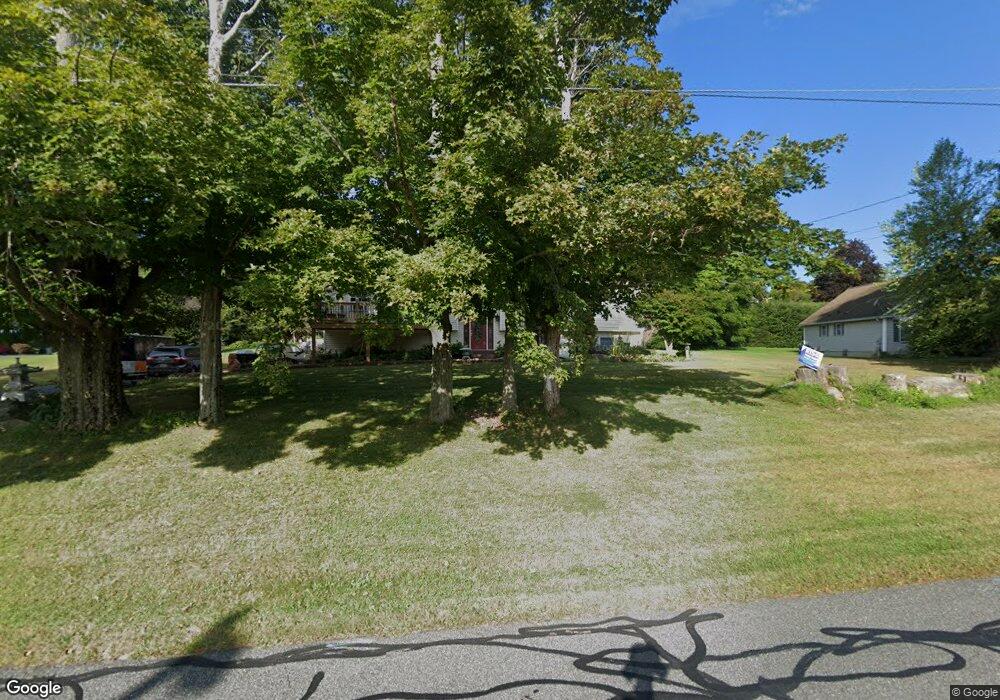
This home is located at 265 Greylock St, Lee, MA 01238 and is currently estimated at $555,341, approximately $343 per square foot. 265 Greylock St is a home located in Berkshire County with nearby schools including Lee Elementary School and Lee Middle/High School.
Ownership History
We collect this data history from publicly available records. To have your information removed, we recommend requesting removal directly through your county’s website.
Purchase Details
Home Financials for this Owner
Home Financials are based on the most recent Mortgage that was taken out on this home.Purchase Details
Home Values in the Area
Average Home Value in this Area
Purchase History
We collect this data history from publicly available records. To have your information removed, we recommend requesting removal directly through your county’s website.
| Date | Buyer | Sale Price | Title Company |
|---|---|---|---|
| $250,000 | None Available | ||
| $50,000 | -- |
Mortgage History
We collect this data history from publicly available records. To have your information removed, we recommend requesting removal directly through your county’s website.
| Date | Status | Borrower | Loan Amount |
|---|---|---|---|
| Open | $54,000 | ||
| Closed | $45,000 | ||
| Closed | $18,000 | ||
| Open | $250,000 | ||
| Previous Owner | $145,000 | ||
| Previous Owner | $70,000 | ||
| Previous Owner | $30,000 |
Tax History
We collect this data history from publicly available records. To have your information removed, we recommend requesting removal directly through your county’s website.
| Year | Tax Paid | Tax Assessment Tax Assessment Total Assessment is a certain percentage of the fair market value that is determined by local assessors to be the total taxable value of land and additions on the property. | Land | Improvement |
|---|---|---|---|---|
| 2025 | $5,516 | $490,300 | $111,900 | $378,400 |
| 2024 | $5,206 | $463,200 | $106,900 | $356,300 |
| 2023 | $4,872 | $411,800 | $102,700 | $309,100 |
| 2022 | $4,790 | $350,900 | $96,600 | $254,300 |
| 2021 | $4,690 | $319,500 | $87,100 | $232,400 |
| 2020 | $4,680 | $318,800 | $81,200 | $237,600 |
| 2019 | $4,743 | $320,900 | $83,300 | $237,600 |
| 2018 | $4,695 | $320,900 | $83,300 | $237,600 |
| 2017 | $4,578 | $311,000 | $71,100 | $239,900 |
| 2016 | $4,498 | $308,900 | $69,000 | $239,900 |
| 2015 | $4,349 | $308,900 | $69,000 | $239,900 |
| 2014 | $4,095 | $289,400 | $69,000 | $220,400 |
Map
- 170 Orchard St
- 255 Greylock St
- 160 Orchard St
- 245 Greylock St
- 165 Orchard St
- 175 Orchard St
- 140 Orchard St
- 145 Orchard St
- 25 St Mary's Ave
- 25 Saint Marys Ave
- 130 Orchard St
- 5 Leonard Ave
- 35 Saint Mary's Ave
- 35 Saint Marys Ave
- 135 Orchard St
- 15 Leonard Ave
- 50 Saint Marys Ave
- 335 Greylock St
- 225 Greylock St
- 235 Greylock St
Ask me questions while you tour the home.