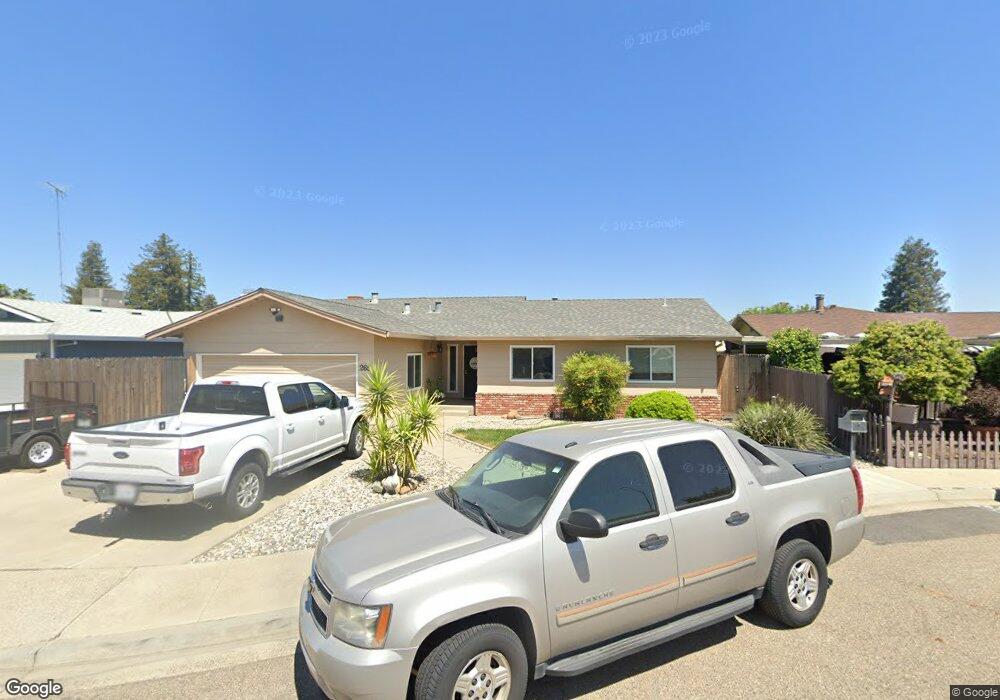
265 Hope Ct Turlock, CA 95382
Estimated Value: $401,713 - $439,000
3
Beds
2
Baths
1,348
Sq Ft
$312/Sq Ft
Est. Value
About This Home
This home is located at 265 Hope Ct, Turlock, CA 95382 and is currently estimated at $420,928, approximately $312 per square foot. 265 Hope Ct is a home located in Stanislaus County with nearby schools including Walter M. Brown Elementary School, Marvin A. Dutcher Middle School, and Turlock Junior High School.
Ownership History
Date
Name
Owned For
Owner Type
Purchase Details
Closed on
Apr 15, 2021
Sold by
Deleon Jose and Deleon Coleen E
Bought by
Deleon Jose and Deleon Coleen E
Current Estimated Value
Home Financials for this Owner
Home Financials are based on the most recent Mortgage that was taken out on this home.
Original Mortgage
$93,000
Interest Rate
2.8%
Mortgage Type
New Conventional
Purchase Details
Closed on
Jun 4, 2019
Sold by
Deleon Jose and Deleon Coleen E
Bought by
Deleon Family Trust
Purchase Details
Closed on
Nov 14, 2011
Sold by
Deleon Colleen E
Bought by
Deleon Coleen E and Deleon Jose
Home Financials for this Owner
Home Financials are based on the most recent Mortgage that was taken out on this home.
Original Mortgage
$106,800
Interest Rate
4.09%
Mortgage Type
New Conventional
Purchase Details
Closed on
Nov 27, 2002
Sold by
Deleon Jose
Bought by
Deleon Coleen E
Home Financials for this Owner
Home Financials are based on the most recent Mortgage that was taken out on this home.
Original Mortgage
$164,000
Interest Rate
6.28%
Mortgage Type
Purchase Money Mortgage
Create a Home Valuation Report for This Property
The Home Valuation Report is an in-depth analysis detailing your home's value as well as a comparison with similar homes in the area
Purchase History
| Date | Buyer | Sale Price | Title Company |
|---|---|---|---|
| Deleon Jose | -- | First American Title Ins Co | |
| Deleon Jose | -- | First American Title Ins Co | |
| Deleon Family Trust | -- | None Available | |
| Deleon Coleen E | -- | First American Title Company | |
| Deleon Coleen E | -- | Chicago Title | |
| Deleon Coleen E | -- | Chicago Title |
Source: Public Records
Mortgage History
| Date | Status | Borrower | Loan Amount |
|---|---|---|---|
| Closed | Deleon Jose | $93,000 | |
| Closed | Deleon Coleen E | $106,800 | |
| Closed | Deleon Coleen E | $164,000 |
Source: Public Records
Tax History
| Year | Tax Paid | Tax Assessment Tax Assessment Total Assessment is a certain percentage of the fair market value that is determined by local assessors to be the total taxable value of land and additions on the property. | Land | Improvement |
|---|---|---|---|---|
| 2025 | $1,223 | $120,676 | $36,213 | $84,463 |
| 2024 | $1,199 | $118,310 | $35,503 | $82,807 |
| 2023 | $1,195 | $115,991 | $34,807 | $81,184 |
| 2022 | $1,179 | $113,718 | $34,125 | $79,593 |
| 2021 | $1,160 | $111,489 | $33,456 | $78,033 |
| 2020 | $1,151 | $110,346 | $33,113 | $77,233 |
| 2019 | $1,131 | $108,183 | $32,464 | $75,719 |
| 2018 | $1,128 | $106,063 | $31,828 | $74,235 |
| 2017 | $1,100 | $103,984 | $31,204 | $72,780 |
| 2016 | $1,026 | $101,946 | $30,593 | $71,353 |
| 2015 | $1,016 | $100,416 | $30,134 | $70,282 |
| 2014 | $1,004 | $98,450 | $29,544 | $68,906 |
Source: Public Records
Map
Nearby Homes
- 2140 Georgia Way
- 517 W Tuolumne Rd
- 2241 Rochelle Ave
- 1880 Donnelly Park Dr
- 2140 Rochelle Ave
- 100 Pedras Rd
- 1733 Geer Rd
- 2900 Andre Ln Unit 241
- 2905 Niagra St Unit 257
- 2621 Dels Ln
- 425 20th Century Blvd Unit E-1
- 425 20th Century Blvd Unit A13
- 345 Riviera Way
- 3036 Andre Ln
- 2720 Brooks Ct
- 3148 Andre Ln
- 125 Hedstrom Rd
- 1186 Kay Cir
- 1366 Geer Rd
- 680 Sherri Way
Your Personal Tour Guide
Ask me questions while you tour the home.