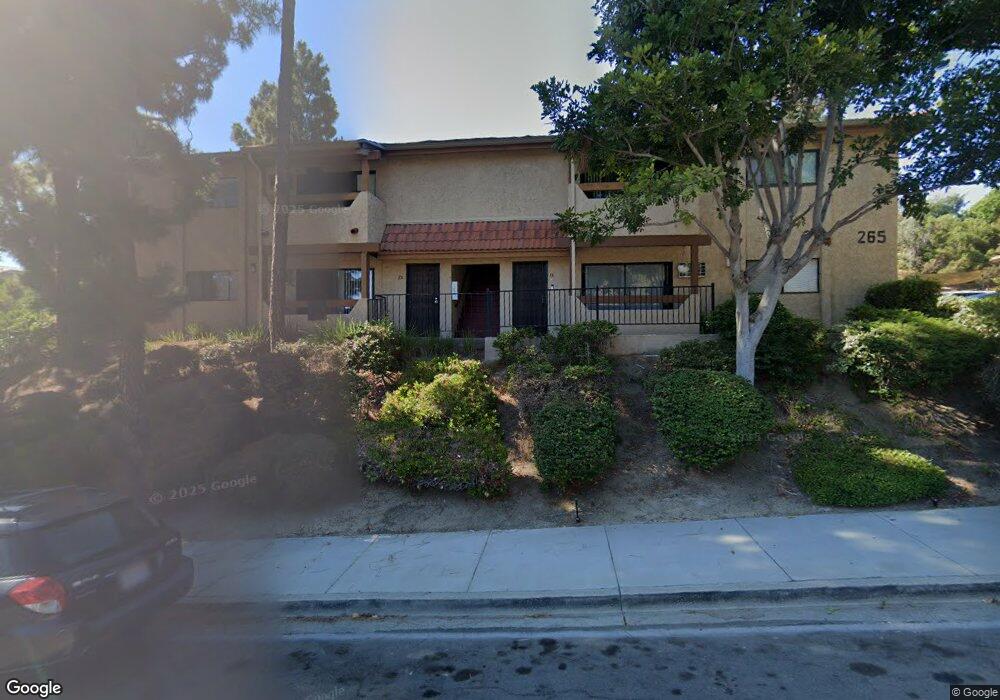
265 Loma Alta Dr Unit D1 Oceanside, CA 92054
Loma Alta NeighborhoodEstimated Value: $393,000 - $438,000
2
Beds
1
Bath
836
Sq Ft
$500/Sq Ft
Est. Value
About This Home
This home is located at 265 Loma Alta Dr Unit D1, Oceanside, CA 92054 and is currently estimated at $417,722, approximately $499 per square foot. 265 Loma Alta Dr Unit D1 is a home located in San Diego County with nearby schools including Mission Elementary School, Oceanside High School, and Oceanside Adventist Elementary School.
Ownership History
Date
Name
Owned For
Owner Type
Purchase Details
Closed on
Oct 20, 2011
Sold by
Furstenfeld Gary C
Bought by
Economy Print & Image Inc
Current Estimated Value
Purchase Details
Closed on
Oct 9, 2008
Sold by
Furstenfeld Gary C
Bought by
Gary C Furstenfeld 2008 Trust
Purchase Details
Closed on
Feb 23, 2005
Sold by
Furstenfeld Gary C and Furstenfeld Janice K
Bought by
Furstenfeld Gary C
Home Financials for this Owner
Home Financials are based on the most recent Mortgage that was taken out on this home.
Original Mortgage
$100,000
Interest Rate
5.87%
Mortgage Type
Stand Alone Refi Refinance Of Original Loan
Create a Home Valuation Report for This Property
The Home Valuation Report is an in-depth analysis detailing your home's value as well as a comparison with similar homes in the area
Home Values in the Area
Average Home Value in this Area
Purchase History
| Date | Buyer | Sale Price | Title Company |
|---|---|---|---|
| Economy Print & Image Inc | $71,100 | None Available | |
| Gary C Furstenfeld 2008 Trust | -- | None Available | |
| Furstenfeld Gary C | -- | Ticor Title San Diego |
Source: Public Records
Mortgage History
| Date | Status | Borrower | Loan Amount |
|---|---|---|---|
| Previous Owner | Furstenfeld Gary C | $100,000 |
Source: Public Records
Tax History Compared to Growth
Tax History
| Year | Tax Paid | Tax Assessment Tax Assessment Total Assessment is a certain percentage of the fair market value that is determined by local assessors to be the total taxable value of land and additions on the property. | Land | Improvement |
|---|---|---|---|---|
| 2025 | $1,146 | $100,470 | $31,394 | $69,076 |
| 2024 | $1,146 | $98,501 | $30,779 | $67,722 |
| 2023 | $1,111 | $96,571 | $30,176 | $66,395 |
| 2022 | $1,094 | $94,679 | $29,585 | $65,094 |
| 2021 | $1,099 | $92,823 | $29,005 | $63,818 |
| 2020 | $1,066 | $91,872 | $28,708 | $63,164 |
| 2019 | $1,036 | $90,072 | $28,146 | $61,926 |
| 2018 | $1,025 | $88,307 | $27,595 | $60,712 |
| 2017 | $1,006 | $86,576 | $27,054 | $59,522 |
| 2016 | $974 | $84,879 | $26,524 | $58,355 |
| 2015 | $947 | $83,605 | $26,126 | $57,479 |
| 2014 | $912 | $81,969 | $25,615 | $56,354 |
Source: Public Records
Map
Nearby Homes
- 506 Canyon Dr Unit 85
- 506 Canyon Dr Unit 61
- 0 Saratoga St
- 552 Canyon Dr Unit 29
- 2146 Foster St
- 0 Crouch St
- 216 Pajama Dr
- 2710 Mesa Dr
- 2743 Mesa Dr
- 1786 Jasmine Way
- 2136 Oceanside Blvd
- 0 Amick St Unit 1.73 250034248
- 2250 Oceanside Blvd
- 1767 Ragtime Way
- 116 N Barnwell St
- 2867 Turnbull St
- 2813 Cottingham St
- 1303 Crestridge Dr
- 2959 Butler St
- 320 Isthmus Way Unit 31
- 265 Loma Alta Dr Unit A
- 265 Loma Alta Dr
- 265 Loma Alta Dr Unit 8B
- 265 Loma Alta Dr Unit C
- 265 Loma Alta Dr Unit 6C
- 265 Loma Alta Dr Unit C5
- 265 Loma Alta Dr Unit A4
- 265 Loma Alta Dr Unit C3
- 265 Loma Alta Dr Unit A7
- 265 Loma Alta Dr Unit D6
- 265 Loma Alta Dr Unit B4
- 265 Loma Alta Dr Unit C1
- 265 Loma Alta Dr Unit B8
- 265 Loma Alta Dr Unit D3
- 265 Loma Alta Dr Unit A6
- 265 Loma Alta Dr Unit A5
- 265 Loma Alta Dr Unit C8
- 265 Loma Alta Dr Unit B03
- 265 Loma Alta Dr Unit C4
- 265 Loma Alta Dr Unit C7