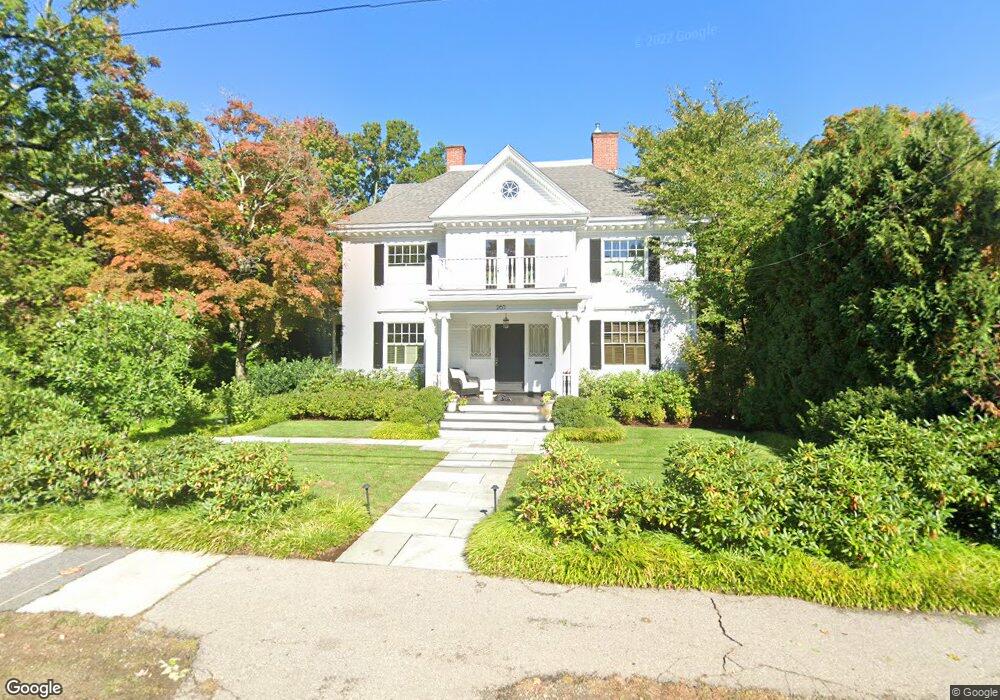
265 Otis St West Newton, MA 02465
West Newton NeighborhoodEstimated Value: $4,229,000 - $5,933,000
6
Beds
5
Baths
6,235
Sq Ft
$802/Sq Ft
Est. Value
About This Home
This home is located at 265 Otis St, West Newton, MA 02465 and is currently estimated at $5,001,427, approximately $802 per square foot. 265 Otis St is a home located in Middlesex County with nearby schools including Peirce Elementary School, F.A. Day Middle School, and Newton North High School.
Ownership History
Date
Name
Owned For
Owner Type
Purchase Details
Closed on
May 7, 2014
Sold by
Kumin Michael A and Kumin Toby
Bought by
Toby G Kumin T and Kumin Toby G
Current Estimated Value
Purchase Details
Closed on
Oct 9, 2009
Sold by
Tudor John and Sylvester Dawn
Bought by
Kumin Michael A and Kumin Toby
Home Financials for this Owner
Home Financials are based on the most recent Mortgage that was taken out on this home.
Original Mortgage
$1,912,350
Interest Rate
5.14%
Mortgage Type
Purchase Money Mortgage
Purchase Details
Closed on
Jun 11, 2007
Sold by
Acker David E and Schieber-Acker Traude R
Bought by
Sylvester Dawn and Tudor John
Home Financials for this Owner
Home Financials are based on the most recent Mortgage that was taken out on this home.
Original Mortgage
$1,500,000
Interest Rate
6%
Mortgage Type
Purchase Money Mortgage
Purchase Details
Closed on
Jun 2, 2004
Sold by
Schieber-Traude Acker R and Acker David E
Bought by
Taylor Robert E and Taylor Sandra L
Create a Home Valuation Report for This Property
The Home Valuation Report is an in-depth analysis detailing your home's value as well as a comparison with similar homes in the area
Home Values in the Area
Average Home Value in this Area
Purchase History
| Date | Buyer | Sale Price | Title Company |
|---|---|---|---|
| Toby G Kumin T | -- | -- | |
| Kumin Michael A | $3,187,250 | -- | |
| Sylvester Dawn | $2,120,000 | -- | |
| Taylor Robert E | $21,000 | -- |
Source: Public Records
Mortgage History
| Date | Status | Borrower | Loan Amount |
|---|---|---|---|
| Previous Owner | Kumin Michael A | $1,912,350 | |
| Previous Owner | Sylvester Dawn | $1,500,000 |
Source: Public Records
Tax History Compared to Growth
Tax History
| Year | Tax Paid | Tax Assessment Tax Assessment Total Assessment is a certain percentage of the fair market value that is determined by local assessors to be the total taxable value of land and additions on the property. | Land | Improvement |
|---|---|---|---|---|
| 2025 | $55,297 | $5,642,600 | $1,391,400 | $4,251,200 |
| 2024 | $53,468 | $5,478,300 | $1,350,900 | $4,127,400 |
| 2023 | $51,984 | $5,106,500 | $1,063,800 | $4,042,700 |
| 2022 | $49,741 | $4,728,200 | $985,000 | $3,743,200 |
| 2021 | $47,996 | $4,460,600 | $929,200 | $3,531,400 |
| 2020 | $46,569 | $4,460,600 | $929,200 | $3,531,400 |
| 2019 | $45,256 | $4,330,700 | $902,100 | $3,428,600 |
| 2018 | $39,293 | $3,631,500 | $809,600 | $2,821,900 |
| 2017 | $38,096 | $3,425,900 | $763,800 | $2,662,100 |
| 2016 | $36,436 | $3,201,800 | $713,800 | $2,488,000 |
| 2015 | $34,741 | $2,992,300 | $667,100 | $2,325,200 |
Source: Public Records
Map
Nearby Homes
- 4 Hosmer Cir
- 318 Austin St Unit A
- 140 Mount Vernon St
- 70 Bigelow Rd
- 79 Chestnut St Unit 2
- 12 Wiswall St
- 4 Wiswall St
- 33 Birch Hill Rd
- 27 Cross St Unit 27
- 39 Valentine Park
- 20 Birch Hill Rd
- 12 Inis Cir
- 18 Sewall St
- 222 Prince St
- 279 Chestnut St
- 308 Prince St
- 935 Washington St Unit 8
- 935 Washington St (Rear Facing) Unit 11
- 429 Cherry St Unit 11
- 46 Ellis Rd