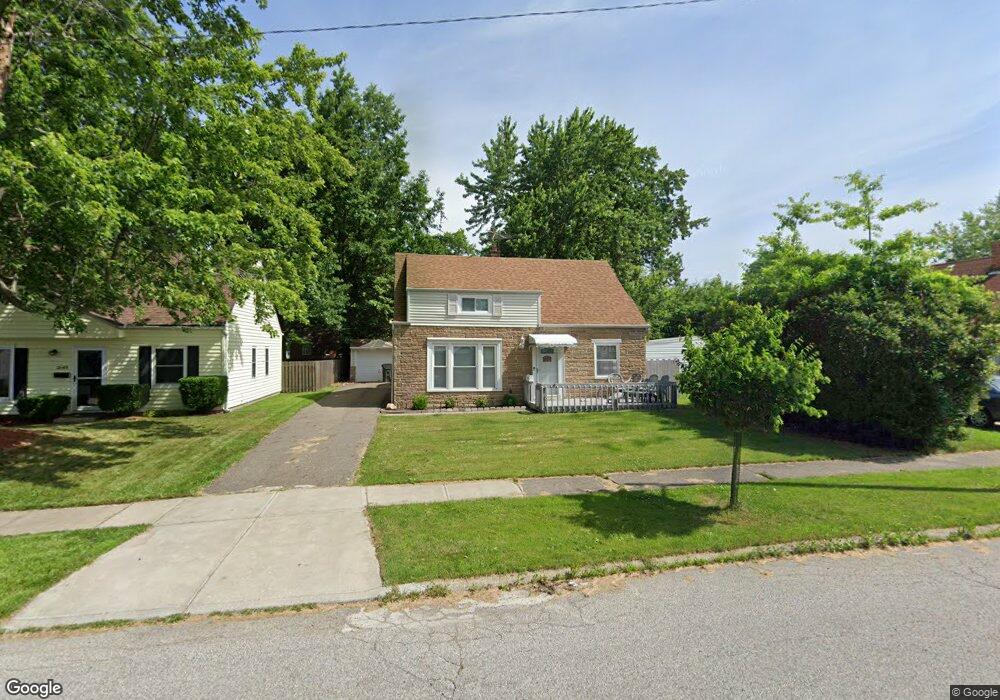
26501 Farringdon Ave Euclid, OH 44132
Estimated Value: $130,393 - $152,000
4
Beds
1
Bath
1,442
Sq Ft
$99/Sq Ft
Est. Value
About This Home
This home is located at 26501 Farringdon Ave, Euclid, OH 44132 and is currently estimated at $143,348, approximately $99 per square foot. 26501 Farringdon Ave is a home located in Cuyahoga County with nearby schools including Shoreview Elementary School, Euclid High School, and Ss. Robert & William Catholic School.
Ownership History
Date
Name
Owned For
Owner Type
Purchase Details
Closed on
Nov 16, 2017
Sold by
Emser Ronald R and Emser Laura J
Bought by
Driscoll Ryan C
Current Estimated Value
Home Financials for this Owner
Home Financials are based on the most recent Mortgage that was taken out on this home.
Original Mortgage
$46,075
Outstanding Balance
$38,609
Interest Rate
3.85%
Mortgage Type
New Conventional
Estimated Equity
$104,739
Purchase Details
Closed on
Mar 28, 1985
Sold by
Hamburg Gerald
Bought by
Emser Ronald R and Emser Laura J
Purchase Details
Closed on
Nov 16, 1984
Sold by
Murphy Timothy I
Bought by
Hamburg Gerald
Purchase Details
Closed on
Oct 15, 1980
Sold by
Skalsky Richard
Bought by
Murphy Timothy I
Purchase Details
Closed on
Aug 20, 1976
Sold by
Noel Gary R and Noel Gail D
Bought by
Skalsky Richard
Purchase Details
Closed on
Jan 1, 1975
Bought by
Noel Gary R and Noel Gail D
Create a Home Valuation Report for This Property
The Home Valuation Report is an in-depth analysis detailing your home's value as well as a comparison with similar homes in the area
Home Values in the Area
Average Home Value in this Area
Purchase History
| Date | Buyer | Sale Price | Title Company |
|---|---|---|---|
| Driscoll Ryan C | $48,500 | Landcastle Title Llc | |
| Emser Ronald R | $47,000 | -- | |
| Hamburg Gerald | $49,000 | -- | |
| Murphy Timothy I | $47,000 | -- | |
| Skalsky Richard | $34,000 | -- | |
| Noel Gary R | -- | -- |
Source: Public Records
Mortgage History
| Date | Status | Borrower | Loan Amount |
|---|---|---|---|
| Open | Driscoll Ryan C | $46,075 |
Source: Public Records
Tax History Compared to Growth
Tax History
| Year | Tax Paid | Tax Assessment Tax Assessment Total Assessment is a certain percentage of the fair market value that is determined by local assessors to be the total taxable value of land and additions on the property. | Land | Improvement |
|---|---|---|---|---|
| 2024 | $2,726 | $39,305 | $7,805 | $31,500 |
| 2023 | $2,416 | $27,660 | $5,920 | $21,740 |
| 2022 | $2,361 | $27,650 | $5,920 | $21,740 |
| 2021 | $2,628 | $27,650 | $5,920 | $21,740 |
| 2020 | $2,493 | $23,840 | $5,110 | $18,730 |
| 2019 | $2,239 | $68,100 | $14,600 | $53,500 |
| 2018 | $2,104 | $23,840 | $5,110 | $18,730 |
| 2017 | $2,118 | $18,560 | $4,240 | $14,320 |
| 2016 | $2,123 | $18,560 | $4,240 | $14,320 |
| 2015 | $1,935 | $18,560 | $4,240 | $14,320 |
| 2014 | $1,935 | $18,560 | $4,240 | $14,320 |
Source: Public Records
Map
Nearby Homes
- 712 E 266th St
- 26471 Farringdon Ave
- 26430 Drakefield Ave
- 26351 Farringdon Ave
- 635 E 261st St
- 780 E 266th St
- 640 E 261st St
- 26471 Shoreview Ave
- 27101 Zeman Ave
- 26171 Shoreview Ave
- 27190 Shoreview Ave
- 25750 Drakefield Ave
- 26230 Oriole Ave
- 25671 Farringdon Ave
- 25700 Briardale Ave
- 25650 Shoreview Ave
- 26268 Leslie Ave
- 795 E 260th St
- 25450 Farringdon Ave
- 25401 Farringdon Ave
- 26491 Farringdon Ave
- 670 E 266th St
- 666 E 266th St
- 26481 Farringdon Ave
- 26530 Zeman Ave
- 26550 Zeman Ave
- 26500 Zeman Ave
- 680 E 266th St
- 26500 Farringdon Ave
- 26490 Farringdon Ave
- 26470 Zeman Ave
- 26480 Farringdon Ave
- 26570 Zeman Ave
- 684 E 266th St
- 26450 Zeman Ave
- 26461 Farringdon Ave
- 26470 Farringdon Ave
- 671 E 266th St
- 26430 Zeman Ave
- 661 E 266th St