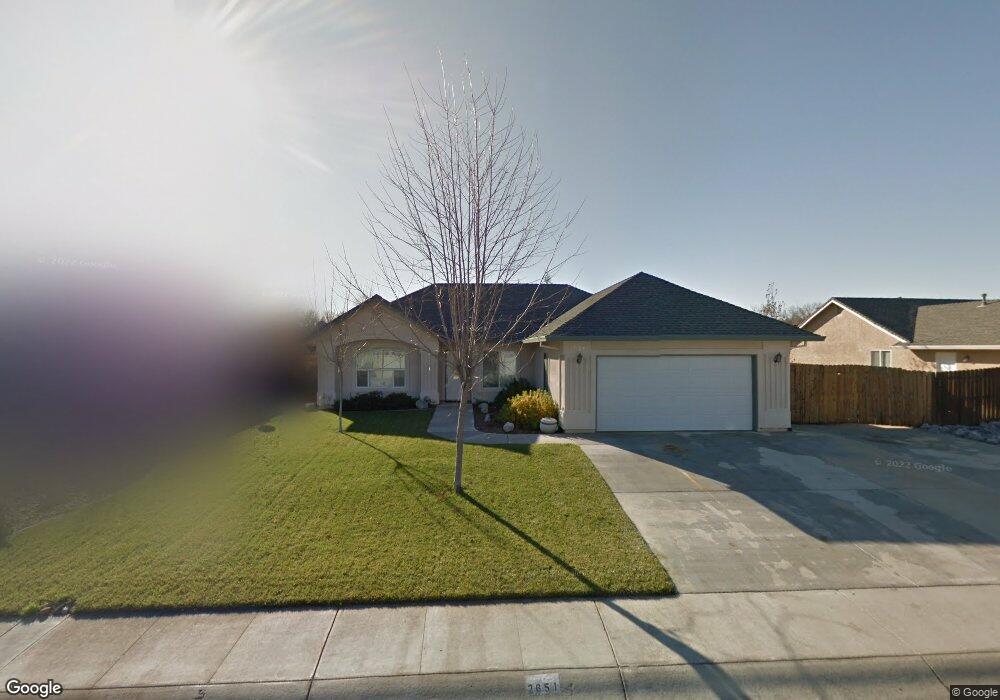
2651 Queens Way Redding, CA 96001
Girvan NeighborhoodEstimated Value: $367,319 - $404,000
3
Beds
2
Baths
1,529
Sq Ft
$252/Sq Ft
Est. Value
About This Home
This home is located at 2651 Queens Way, Redding, CA 96001 and is currently estimated at $385,580, approximately $252 per square foot. 2651 Queens Way is a home located in Shasta County with nearby schools including Bonny View Elementary School, Sequoia Middle School, and Shasta High School.
Ownership History
Date
Name
Owned For
Owner Type
Purchase Details
Closed on
Aug 21, 2019
Sold by
Hudson James C and Hudson Luella M
Bought by
Hudson James C and Hudson Luella M
Current Estimated Value
Purchase Details
Closed on
Feb 20, 2003
Sold by
Palomar Builders Inc
Bought by
Hudson James C and Hudson Luella M
Home Financials for this Owner
Home Financials are based on the most recent Mortgage that was taken out on this home.
Original Mortgage
$148,480
Outstanding Balance
$63,312
Interest Rate
5.89%
Estimated Equity
$322,268
Purchase Details
Closed on
Dec 30, 2002
Sold by
Allen Jeb and Tsai Sue
Bought by
Palomar Builders Inc
Home Financials for this Owner
Home Financials are based on the most recent Mortgage that was taken out on this home.
Original Mortgage
$148,480
Outstanding Balance
$63,312
Interest Rate
5.89%
Estimated Equity
$322,268
Purchase Details
Closed on
Aug 20, 2002
Sold by
Crown Estates Llc
Bought by
Allen Jeb and Tsai Sue
Home Financials for this Owner
Home Financials are based on the most recent Mortgage that was taken out on this home.
Original Mortgage
$2,500,000
Interest Rate
6.52%
Mortgage Type
Construction
Create a Home Valuation Report for This Property
The Home Valuation Report is an in-depth analysis detailing your home's value as well as a comparison with similar homes in the area
Home Values in the Area
Average Home Value in this Area
Purchase History
| Date | Buyer | Sale Price | Title Company |
|---|---|---|---|
| Hudson James C | -- | None Available | |
| Hudson James C | $186,000 | Placer Title Company | |
| Palomar Builders Inc | -- | -- | |
| Allen Jeb | $740,000 | Placer Title Company |
Source: Public Records
Mortgage History
| Date | Status | Borrower | Loan Amount |
|---|---|---|---|
| Open | Hudson James C | $148,480 | |
| Previous Owner | Allen Jeb | $2,500,000 | |
| Closed | Hudson James C | $18,560 |
Source: Public Records
Tax History
| Year | Tax Paid | Tax Assessment Tax Assessment Total Assessment is a certain percentage of the fair market value that is determined by local assessors to be the total taxable value of land and additions on the property. | Land | Improvement |
|---|---|---|---|---|
| 2025 | $2,716 | $268,788 | $66,610 | $202,178 |
| 2024 | $2,673 | $263,518 | $65,304 | $198,214 |
| 2023 | $2,673 | $258,352 | $64,024 | $194,328 |
| 2022 | $2,627 | $253,287 | $62,769 | $190,518 |
| 2021 | $2,613 | $248,322 | $61,539 | $186,783 |
| 2020 | $2,647 | $245,776 | $60,908 | $184,868 |
| 2019 | $2,511 | $240,958 | $59,714 | $181,244 |
| 2018 | $2,532 | $236,235 | $58,544 | $177,691 |
| 2017 | $2,518 | $231,604 | $57,397 | $174,207 |
| 2016 | $2,436 | $227,064 | $56,272 | $170,792 |
| 2015 | $2,404 | $223,654 | $55,427 | $168,227 |
| 2014 | $2,386 | $219,274 | $54,342 | $164,932 |
Source: Public Records
Map
Nearby Homes
- 7575 Pit Rd
- 2652 Brooch Ct
- 7728 Pit Rd
- 2762 Citrine Ave
- 7253 Legacy
- 7022 Marvin Trail
- 7060 Pit Rd
- 7034 David Trail
- 6871 Hemlock St
- 8641 Redbank Rd
- 0 Waverly Manor
- 7035 Riverside Dr
- 6958 Riverside Dr
- 7252 Whitehouse Dr
- 6733 El Camino Dr
- 6633 Southgate Dr
- 6677 Ferndale Dr
- 6551 El Camino Dr
- 6624 Southgate Dr
- 6681 Riverside Dr
- 2651 Queens Way Unit 102
- 2641 Queens Way
- 2659 Queens Way Unit 2
- 106 Queens Way
- 69 Queens Way
- 64 Queens Way
- 62 Queens Way
- 99 Queens Way
- 100 Queens Way
- 104 Queens Way
- 59 Queens Way
- 63 Queens Way
- 101 Queens Way
- 2638 Rhinestone Way Unit 89
- 2638 Rhinestone Way
- 2628 Rhinestone Way Unit 88
- 2628 Rhinestone Way
- 2650 Rhinestone Way Unit 90
- 2650 Rhinestone Way
- 2631 Queens Way
Your Personal Tour Guide
Ask me questions while you tour the home.