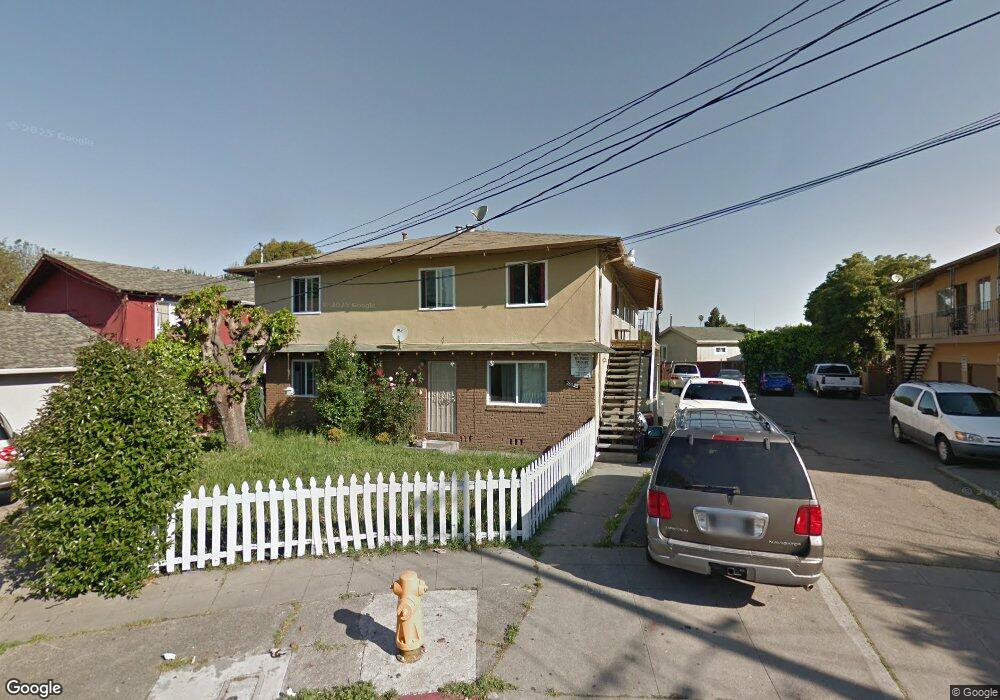
26533 Chisholm Ct Hayward, CA 94544
Harder-Tennyson NeighborhoodEstimated Value: $1,256,000 - $1,736,000
10
Beds
6
Baths
4,590
Sq Ft
$330/Sq Ft
Est. Value
About This Home
This home is located at 26533 Chisholm Ct, Hayward, CA 94544 and is currently estimated at $1,514,357, approximately $329 per square foot. 26533 Chisholm Ct is a home located in Alameda County with nearby schools including Glassbrook Elementary School, Martin Luther King, Jr. Middle School, and Tennyson High School.
Ownership History
Date
Name
Owned For
Owner Type
Purchase Details
Closed on
May 12, 2025
Sold by
Das Chandra
Bought by
Das Revocable Living Trust and Das
Current Estimated Value
Purchase Details
Closed on
Jul 31, 2008
Sold by
Das Chandra Kant
Bought by
Das Chandra Kant and 2008 Das Revocable Trust
Purchase Details
Closed on
Jul 27, 2005
Sold by
Das Chandra Kant and Das Chandra
Bought by
Das Chandra Kant
Purchase Details
Closed on
Nov 24, 2002
Sold by
Das Chandra Kant
Bought by
Das Chandra Kant and Chandra Kant & Raksha B Das Re
Purchase Details
Closed on
Jun 18, 1999
Sold by
Das Raksha B
Bought by
Das Chandra K
Home Financials for this Owner
Home Financials are based on the most recent Mortgage that was taken out on this home.
Original Mortgage
$224,000
Interest Rate
7.05%
Purchase Details
Closed on
Jun 17, 1999
Sold by
Kwei Company
Bought by
Das Chandra K
Home Financials for this Owner
Home Financials are based on the most recent Mortgage that was taken out on this home.
Original Mortgage
$224,000
Interest Rate
7.05%
Create a Home Valuation Report for This Property
The Home Valuation Report is an in-depth analysis detailing your home's value as well as a comparison with similar homes in the area
Home Values in the Area
Average Home Value in this Area
Purchase History
| Date | Buyer | Sale Price | Title Company |
|---|---|---|---|
| Das Revocable Living Trust | -- | None Listed On Document | |
| Das Chandra Kant | -- | None Listed On Document | |
| Das Chandra Kant | -- | None Available | |
| Das Chandra Kant | -- | -- | |
| Das Chandra Kant | -- | -- | |
| Das Chandra K | -- | North American Title Co | |
| Das Chandra K | $320,000 | North American Title Co |
Source: Public Records
Mortgage History
| Date | Status | Borrower | Loan Amount |
|---|---|---|---|
| Previous Owner | Das Chandra K | $224,000 |
Source: Public Records
Tax History Compared to Growth
Tax History
| Year | Tax Paid | Tax Assessment Tax Assessment Total Assessment is a certain percentage of the fair market value that is determined by local assessors to be the total taxable value of land and additions on the property. | Land | Improvement |
|---|---|---|---|---|
| 2025 | $6,514 | $501,637 | $150,491 | $351,146 |
| 2024 | $6,514 | $491,804 | $147,541 | $344,263 |
| 2023 | $6,416 | $482,162 | $144,648 | $337,514 |
| 2022 | $6,293 | $472,710 | $141,813 | $330,897 |
| 2021 | $6,238 | $463,442 | $139,032 | $324,410 |
| 2020 | $6,171 | $458,690 | $137,607 | $321,083 |
| 2019 | $6,216 | $449,698 | $134,909 | $314,789 |
| 2018 | $5,851 | $440,882 | $132,264 | $308,618 |
| 2017 | $5,724 | $432,240 | $129,672 | $302,568 |
| 2016 | $5,410 | $423,765 | $127,129 | $296,636 |
| 2015 | $5,309 | $417,401 | $125,220 | $292,181 |
| 2014 | $5,056 | $409,224 | $122,767 | $286,457 |
Source: Public Records
Map
Nearby Homes
- 318 Dumont Ave
- 26231 Gamboa St
- 26361 Huntwood Ave
- 399 Schafer Rd
- 26047 Gading Rd
- 250 Schafer Rd
- 26555 Underwood Ave
- 1021 Cheryl Ann Cir Unit 62
- 1235 Westwood St
- 1029 Cheryl Ann Cir Unit 66
- 25478 Huntwood Ave Unit 18
- 1338 Thais Ln
- 26132 Jane Ave
- 27418 Susan Place Unit 3
- 26623 Eldridge Ave
- 25696 Lander Ave
- 27505 Tampa Ave Unit 15
- 1481 Rieger Ave
- 27426 Patrick Ave
- 25353 Tarman Ave
- 26539 Chisholm Ct
- 26532 Chisholm Ct
- 266 Newhall St
- 258 Newhall St
- 26540 Chisholm Ct
- 26548 Chisholm Ct
- 26555 Chisholm Ct Unit 3
- 26364 Ventura Ave
- 245 Turlock Way
- 250 Newhall St
- 26556 Chisholm Ct
- 26356 Ventura Ave
- 26563 Chisholm Ct
- 242 Newhall St
- 26370 Ventura Ave
- 26348 Ventura Ave
- 26564 Chisholm Ct
- 237 Turlock Way
- 26340 Ventura Ave