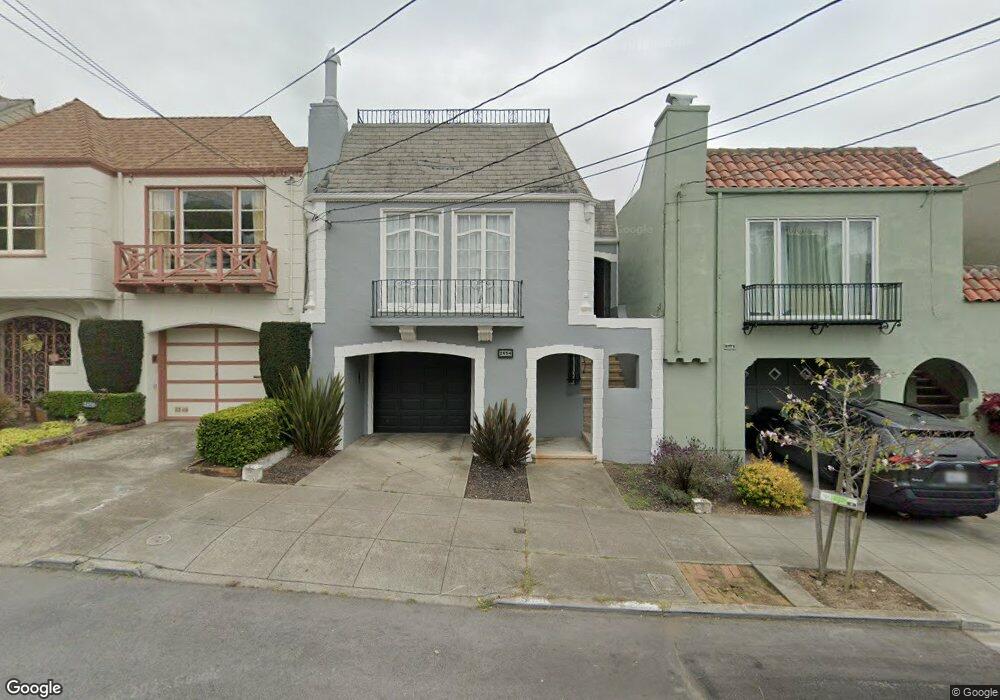
2654 15th Ave San Francisco, CA 94127
West Portal NeighborhoodEstimated Value: $1,661,000 - $2,089,000
2
Beds
1
Bath
1,525
Sq Ft
$1,265/Sq Ft
Est. Value
About This Home
This home is located at 2654 15th Ave, San Francisco, CA 94127 and is currently estimated at $1,929,052, approximately $1,264 per square foot. 2654 15th Ave is a home located in San Francisco County with nearby schools including West Portal Elementary School, Hoover (Herbert) Middle School, and St. Stephen School.
Ownership History
Date
Name
Owned For
Owner Type
Purchase Details
Closed on
May 1, 2017
Sold by
Yohanan Joreita and Yohanan Jana
Bought by
Hussain Naveed M and Hussain Alefiya N
Current Estimated Value
Purchase Details
Closed on
Nov 9, 2000
Sold by
Schwed Randall C and Tarpey Mark A W
Bought by
Yohanan Joni L
Home Financials for this Owner
Home Financials are based on the most recent Mortgage that was taken out on this home.
Original Mortgage
$300,000
Interest Rate
7.86%
Purchase Details
Closed on
Feb 27, 1995
Sold by
Dickenson Karen Kristine
Bought by
Schwed Randall C and Tarpey Mark A W
Home Financials for this Owner
Home Financials are based on the most recent Mortgage that was taken out on this home.
Original Mortgage
$300,000
Interest Rate
9.09%
Create a Home Valuation Report for This Property
The Home Valuation Report is an in-depth analysis detailing your home's value as well as a comparison with similar homes in the area
Home Values in the Area
Average Home Value in this Area
Purchase History
| Date | Buyer | Sale Price | Title Company |
|---|---|---|---|
| Hussain Naveed M | $1,625,000 | Chicago Title Company | |
| Yohanan Joni L | $760,000 | Alliance Title Company | |
| Schwed Randall C | $320,000 | North American Title Company |
Source: Public Records
Mortgage History
| Date | Status | Borrower | Loan Amount |
|---|---|---|---|
| Previous Owner | Yohanan Joni L | $300,000 | |
| Previous Owner | Schwed Randall C | $300,000 |
Source: Public Records
Tax History Compared to Growth
Tax History
| Year | Tax Paid | Tax Assessment Tax Assessment Total Assessment is a certain percentage of the fair market value that is determined by local assessors to be the total taxable value of land and additions on the property. | Land | Improvement |
|---|---|---|---|---|
| 2025 | $22,449 | $1,885,946 | $1,320,164 | $565,782 |
| 2024 | $22,449 | $1,848,968 | $1,294,279 | $554,689 |
| 2023 | $22,114 | $1,812,714 | $1,268,901 | $543,813 |
| 2022 | $21,699 | $1,777,171 | $1,244,021 | $533,150 |
| 2021 | $21,316 | $1,742,326 | $1,219,629 | $522,697 |
| 2020 | $21,407 | $1,724,462 | $1,207,124 | $517,338 |
| 2019 | $20,672 | $1,690,650 | $1,183,455 | $507,195 |
| 2018 | $19,975 | $1,657,500 | $1,160,250 | $497,250 |
| 2017 | $11,877 | $986,736 | $592,044 | $394,692 |
| 2016 | $11,677 | $967,389 | $580,436 | $386,953 |
| 2015 | $11,531 | $952,859 | $571,718 | $381,141 |
| 2014 | $11,226 | $934,194 | $560,519 | $373,675 |
Source: Public Records
Map
Nearby Homes
- 325 Wawona St
- 160 Wawona St
- 2475 18th Ave
- 44 Yerba Buena Ave
- 95 Junipero Serra Blvd
- 8 San Lorenzo Way
- 270 Claremont Blvd
- 634-636 Taraval St
- 130 San Pablo Ave
- 154 San Pablo Ave
- 2978 20th Ave
- 2292 16th Ave
- 730 Santiago St
- 1475 Monterey Blvd
- 154 Maywood Dr
- 353 Rivera St
- 75 San Jacinto Way
- 111 Edgehill Way
- 345 Moncada Way
- 2266 9th Ave