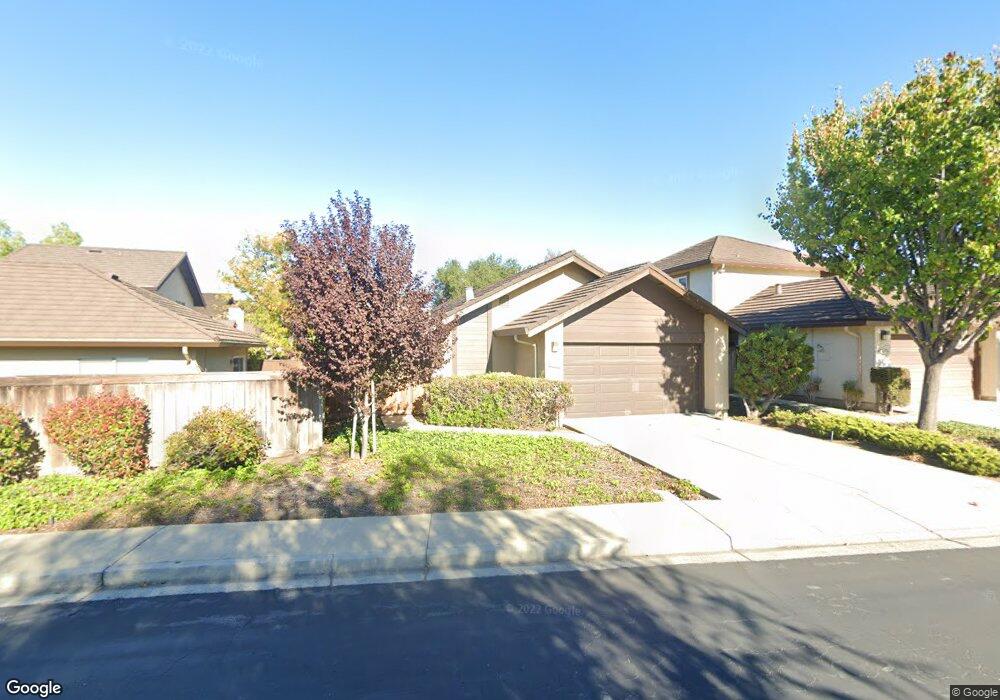
2655 Mabury Square San Jose, CA 95133
Penitencia NeighborhoodEstimated Value: $1,204,349 - $1,389,000
3
Beds
2
Baths
1,260
Sq Ft
$1,044/Sq Ft
Est. Value
About This Home
This home is located at 2655 Mabury Square, San Jose, CA 95133 and is currently estimated at $1,315,837, approximately $1,044 per square foot. 2655 Mabury Square is a home located in Santa Clara County with nearby schools including Summerdale Elementary School, Piedmont Middle School, and Independence High School.
Ownership History
Date
Name
Owned For
Owner Type
Purchase Details
Closed on
Jan 14, 1997
Sold by
Shepard Sandra J and Shepard Sandra J
Bought by
Ogden Peter Anthony
Current Estimated Value
Home Financials for this Owner
Home Financials are based on the most recent Mortgage that was taken out on this home.
Original Mortgage
$166,500
Outstanding Balance
$17,802
Interest Rate
7.58%
Estimated Equity
$1,298,035
Create a Home Valuation Report for This Property
The Home Valuation Report is an in-depth analysis detailing your home's value as well as a comparison with similar homes in the area
Home Values in the Area
Average Home Value in this Area
Purchase History
| Date | Buyer | Sale Price | Title Company |
|---|---|---|---|
| Ogden Peter Anthony | $226,500 | Old Republic Title Company |
Source: Public Records
Mortgage History
| Date | Status | Borrower | Loan Amount |
|---|---|---|---|
| Open | Ogden Peter Anthony | $166,500 |
Source: Public Records
Tax History Compared to Growth
Tax History
| Year | Tax Paid | Tax Assessment Tax Assessment Total Assessment is a certain percentage of the fair market value that is determined by local assessors to be the total taxable value of land and additions on the property. | Land | Improvement |
|---|---|---|---|---|
| 2025 | $6,045 | $368,874 | $147,545 | $221,329 |
| 2024 | $6,045 | $361,642 | $144,652 | $216,990 |
| 2023 | $5,911 | $354,552 | $141,816 | $212,736 |
| 2022 | $5,878 | $347,601 | $139,036 | $208,565 |
| 2021 | $5,663 | $340,786 | $136,310 | $204,476 |
| 2020 | $5,468 | $337,293 | $134,913 | $202,380 |
| 2019 | $5,255 | $330,680 | $132,268 | $198,412 |
| 2018 | $5,169 | $324,197 | $129,675 | $194,522 |
| 2017 | $5,181 | $317,841 | $127,133 | $190,708 |
| 2016 | $4,962 | $311,610 | $124,641 | $186,969 |
| 2015 | $4,897 | $306,930 | $122,769 | $184,161 |
| 2014 | $4,338 | $300,919 | $120,365 | $180,554 |
Source: Public Records
Map
Nearby Homes
- 2714 Mabury Square
- 2598 Mabury Square
- 714 N Capitol Ave
- 825 N Capitol Ave Unit 4
- 2806 Glauser Dr
- 674 Galleon Ct
- 709 Whitewater Ct Unit 44
- 2623 Gimelli Place Unit 139
- 2599 Easton Ln Unit 108
- 2599 Easton Ln Unit 109
- 981 Harcot Ct
- 633 Easton Dr
- 994 Harcot Ct
- 997 Harcot Ct
- 982 Harcot Ct
- 931 ToMcOt Ct
- 998 Harcot Ct
- 990 Harcot Ct
- 970 E Harcot Ct
- 750 Fruit Ranch Loop
- 2659 Mabury Square
- 2663 Mabury Square
- 2643 Mabury Square
- 2639 Mabury Square
- 2607 Mabury Square
- 2635 Mabury Square
- 2603 Mabury Square
- 2667 Mabury Square
- 2599 Mabury Square
- 2654 Mabury Square
- 2631 Mabury Square
- 2595 Mabury Square
- 2671 Mabury Square
- 2627 Mabury Square
- 2591 Mabury Square
- 2650 Mabury Square
- 2642 Mabury Square
- 2725 Mabury Square
- 2721 Mabury Square
- 2646 Mabury Square