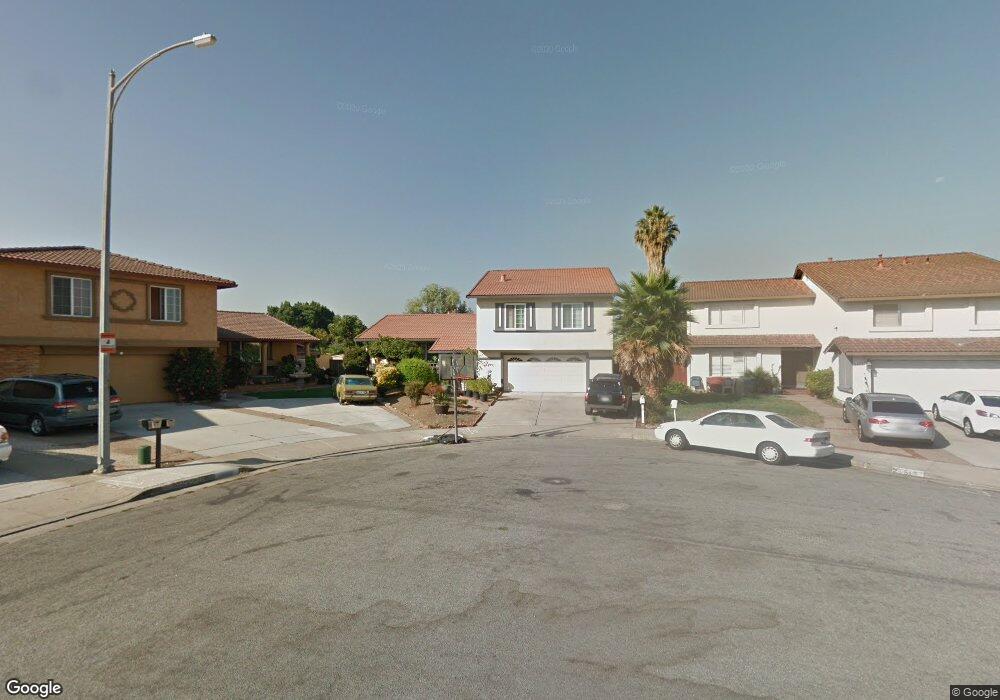
2657 Glen Hancock Ct San Jose, CA 95148
Hidden Glen NeighborhoodEstimated Value: $1,538,000 - $1,886,000
4
Beds
3
Baths
2,113
Sq Ft
$814/Sq Ft
Est. Value
About This Home
This home is located at 2657 Glen Hancock Ct, San Jose, CA 95148 and is currently estimated at $1,719,163, approximately $813 per square foot. 2657 Glen Hancock Ct is a home located in Santa Clara County with nearby schools including Cedar Grove Elementary School, George V. Leyva Intermediate School, and William C. Overfelt High School.
Ownership History
Date
Name
Owned For
Owner Type
Purchase Details
Closed on
Jan 12, 2015
Sold by
Nguyen Don Thien and Nguyen Hoa Thi
Bought by
Nguyen Don Thien and Nguyen Hoa Thi
Current Estimated Value
Home Financials for this Owner
Home Financials are based on the most recent Mortgage that was taken out on this home.
Original Mortgage
$380,000
Outstanding Balance
$289,117
Interest Rate
3.66%
Mortgage Type
New Conventional
Estimated Equity
$1,430,046
Purchase Details
Closed on
Feb 11, 1999
Sold by
Arora Puneet K and Arora Alpana
Bought by
Nguyen Don Thien and Nguyen Hoa Thi
Home Financials for this Owner
Home Financials are based on the most recent Mortgage that was taken out on this home.
Original Mortgage
$262,000
Interest Rate
6.79%
Mortgage Type
Stand Alone First
Purchase Details
Closed on
Aug 30, 1996
Sold by
Mcdonald Randy Wayne and Mcdonald Carolina Alicia
Bought by
Arora Puneet K and Arora Alpana
Home Financials for this Owner
Home Financials are based on the most recent Mortgage that was taken out on this home.
Original Mortgage
$220,000
Interest Rate
8.2%
Purchase Details
Closed on
Dec 31, 1993
Sold by
Mcdonald Randy Wayne and Mcdonald Carolina Alicia
Bought by
Mcdonald Randy Wayne and Mcdonald Carolina Alicia
Create a Home Valuation Report for This Property
The Home Valuation Report is an in-depth analysis detailing your home's value as well as a comparison with similar homes in the area
Home Values in the Area
Average Home Value in this Area
Purchase History
| Date | Buyer | Sale Price | Title Company |
|---|---|---|---|
| Nguyen Don Thien | $126,000 | Chicago Title Company | |
| Nguyen Don Thien | $362,000 | First American Title Co | |
| Arora Puneet K | $275,000 | Santa Clara Land Title Co | |
| Mcdonald Randy Wayne | -- | -- |
Source: Public Records
Mortgage History
| Date | Status | Borrower | Loan Amount |
|---|---|---|---|
| Open | Nguyen Don Thien | $380,000 | |
| Previous Owner | Nguyen Don Thien | $262,000 | |
| Previous Owner | Arora Puneet K | $220,000 | |
| Closed | Arora Puneet K | $27,500 |
Source: Public Records
Tax History Compared to Growth
Tax History
| Year | Tax Paid | Tax Assessment Tax Assessment Total Assessment is a certain percentage of the fair market value that is determined by local assessors to be the total taxable value of land and additions on the property. | Land | Improvement |
|---|---|---|---|---|
| 2025 | $8,633 | $567,490 | $235,144 | $332,346 |
| 2024 | $8,633 | $556,364 | $230,534 | $325,830 |
| 2023 | $8,452 | $545,456 | $226,014 | $319,442 |
| 2022 | $8,409 | $534,762 | $221,583 | $313,179 |
| 2021 | $8,241 | $524,278 | $217,239 | $307,039 |
| 2020 | $7,879 | $518,903 | $215,012 | $303,891 |
| 2019 | $7,673 | $508,730 | $210,797 | $297,933 |
| 2018 | $7,584 | $498,756 | $206,664 | $292,092 |
| 2017 | $7,460 | $488,977 | $202,612 | $286,365 |
| 2016 | $7,112 | $479,390 | $198,640 | $280,750 |
| 2015 | $7,015 | $472,190 | $195,657 | $276,533 |
| 2014 | $6,394 | $462,942 | $191,825 | $271,117 |
Source: Public Records
Map
Nearby Homes
- 2708 Glen Ferguson Cir
- 2955 Vineyard Park Dr
- 2715 Sugarplum Dr
- 2707 Sugarplum Dr
- 2805 Gavilan Dr
- 2689 Vista Verde Dr
- 2552 Castleton Dr
- 3324 Trebol Ln
- 3344 Quesada Dr
- 3343 Quesada Dr
- 3388 San Saba Dr
- 2574 Whispering Hills Cir Unit 2574
- 2629 Whispering Hills Dr
- 2896 Rathmann Dr
- 2277 Flint Ave
- 2837 Mantis Dr
- 3368 Thrift Place
- 2154 Pastoral Loop
- 2886 Damico Dr
- 3123 Oakgate Way
- 2663 Glen Hancock Ct
- 2651 Glen Hancock Ct
- 2646 Glen Cotswold Ct
- 2640 Glen Cotswold Ct
- 2669 Glen Hancock Ct
- 2645 Glen Hancock Ct
- 2634 Glen Cotswold Ct
- 2653 Glen Cotswold Ct
- 2639 Glen Hancock Ct
- 2664 Glen Hancock Ct
- 2628 Glen Cotswold Ct
- 2646 Glen Hancock Ct
- 2652 Glen Hancock Ct
- 2658 Glen Hancock Ct
- 2735 Britt Ct
- 2647 Glen Cotswold Ct
- 2739 Britt Ct
- 2641 Glen Cotswold Ct
- 2731 Britt Way
- 2640 Glen Hancock Ct