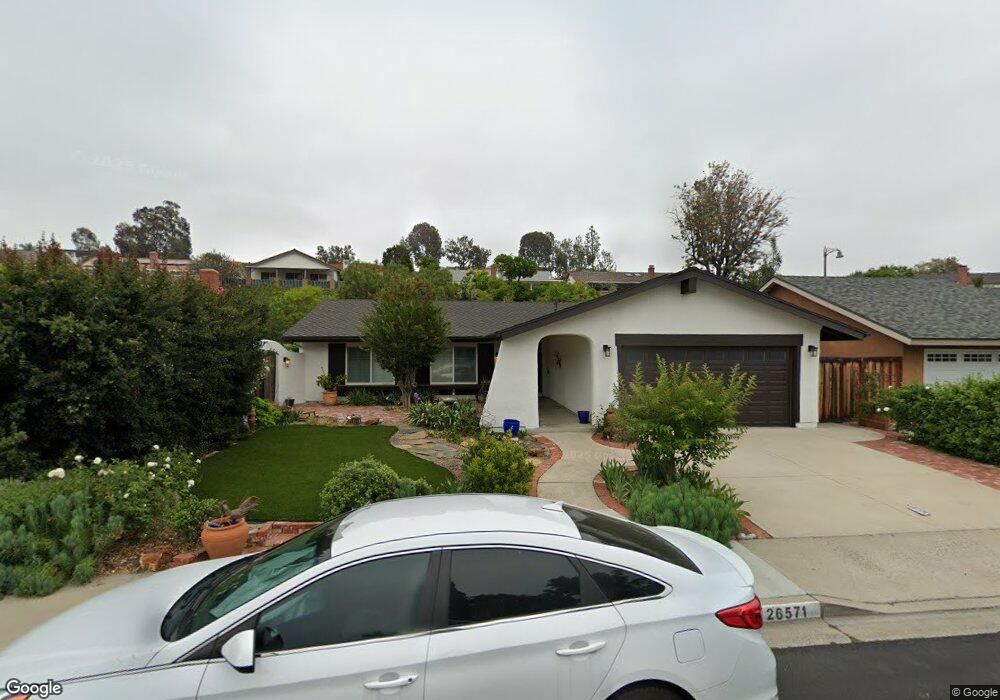
26571 Avenida Deseo Mission Viejo, CA 92691
Estimated Value: $1,148,139 - $1,429,000
3
Beds
2
Baths
1,360
Sq Ft
$923/Sq Ft
Est. Value
About This Home
This home is located at 26571 Avenida Deseo, Mission Viejo, CA 92691 and is currently estimated at $1,255,035, approximately $922 per square foot. 26571 Avenida Deseo is a home located in Orange County with nearby schools including Montevideo Elementary School, La Paz Intermediate School, and Mission Viejo High School.
Ownership History
Date
Name
Owned For
Owner Type
Purchase Details
Closed on
Apr 28, 2020
Sold by
Quiroz Laura
Bought by
Quiroz Laura P and The Quiroz Trust
Current Estimated Value
Purchase Details
Closed on
May 27, 2003
Sold by
Cole Steven R and Cole Pamela A
Bought by
Quiroz Laura
Home Financials for this Owner
Home Financials are based on the most recent Mortgage that was taken out on this home.
Original Mortgage
$346,400
Outstanding Balance
$146,002
Interest Rate
5.26%
Mortgage Type
Purchase Money Mortgage
Estimated Equity
$1,109,033
Purchase Details
Closed on
Apr 26, 1999
Sold by
Robert Cole Steven
Bought by
Cole Steven R and Cole Pamela A
Home Financials for this Owner
Home Financials are based on the most recent Mortgage that was taken out on this home.
Original Mortgage
$180,000
Interest Rate
6.98%
Create a Home Valuation Report for This Property
The Home Valuation Report is an in-depth analysis detailing your home's value as well as a comparison with similar homes in the area
Home Values in the Area
Average Home Value in this Area
Purchase History
| Date | Buyer | Sale Price | Title Company |
|---|---|---|---|
| Quiroz Laura P | -- | None Available | |
| Quiroz Laura | $433,000 | Fidelity National Title Co | |
| Cole Steven R | -- | California Counties Title Co |
Source: Public Records
Mortgage History
| Date | Status | Borrower | Loan Amount |
|---|---|---|---|
| Open | Quiroz Laura | $346,400 | |
| Previous Owner | Cole Steven R | $180,000 |
Source: Public Records
Tax History Compared to Growth
Tax History
| Year | Tax Paid | Tax Assessment Tax Assessment Total Assessment is a certain percentage of the fair market value that is determined by local assessors to be the total taxable value of land and additions on the property. | Land | Improvement |
|---|---|---|---|---|
| 2025 | $6,154 | $615,626 | $523,790 | $91,836 |
| 2024 | $6,154 | $603,555 | $513,519 | $90,036 |
| 2023 | $6,007 | $591,721 | $503,450 | $88,271 |
| 2022 | $5,899 | $580,119 | $493,578 | $86,541 |
| 2021 | $5,780 | $568,745 | $483,900 | $84,845 |
| 2020 | $5,728 | $562,914 | $478,938 | $83,976 |
| 2019 | $5,613 | $551,877 | $469,547 | $82,330 |
| 2018 | $5,506 | $541,056 | $460,340 | $80,716 |
| 2017 | $5,395 | $530,448 | $451,314 | $79,134 |
| 2016 | $5,305 | $520,048 | $442,465 | $77,583 |
| 2015 | $5,240 | $512,237 | $435,819 | $76,418 |
| 2014 | $5,125 | $502,203 | $427,281 | $74,922 |
Source: Public Records
Map
Nearby Homes
- 26655 Avenida Deseo
- 24102 Castilla Ln
- 24201 Salero Ln
- 23912 Via el Rocio
- 23641 Coronel Dr
- 26702 Via Linares
- 24055 Via la Coruna
- 26511 Naccome Dr
- 24312 Chrisanta Dr
- 26302 Los Viveros Unit 152
- 26166 Los Viveros Unit 222
- 26862 Salazar Dr
- 23372 Via Bahia
- 27301 Via Avila
- 23441 Via Ronda
- 26212 La Real Unit D
- 25981 Cordillera Dr
- 23336 Via Bahia
- 27241 Via Burgos
- 23401 Via Linda Unit C
- 26565 Avenida Deseo
- 26575 Avenida Deseo
- 26642 Lope de Vega Dr
- 26561 Avenida Deseo
- 26632 Lope de Vega Dr
- 26646 Lope de Vega Dr
- 26626 Lope de Vega Dr
- 26572 Avenida Deseo
- 26566 Avenida Deseo
- 26581 Avenida Deseo
- 26555 Avenida Deseo
- 26576 Avenida Deseo
- 26622 Lope de Vega Dr
- 26562 Avenida Deseo
- 26662 Lope de Vega Dr
- 26582 Avenida Deseo
- 26551 Avenida Deseo
- 26556 Avenida Deseo
- 26612 Lope de Vega Dr
- 26585 Avenida Deseo