Estimated Value: $355,837 - $372,000
4
Beds
2
Baths
1,356
Sq Ft
$267/Sq Ft
Est. Value
About This Home
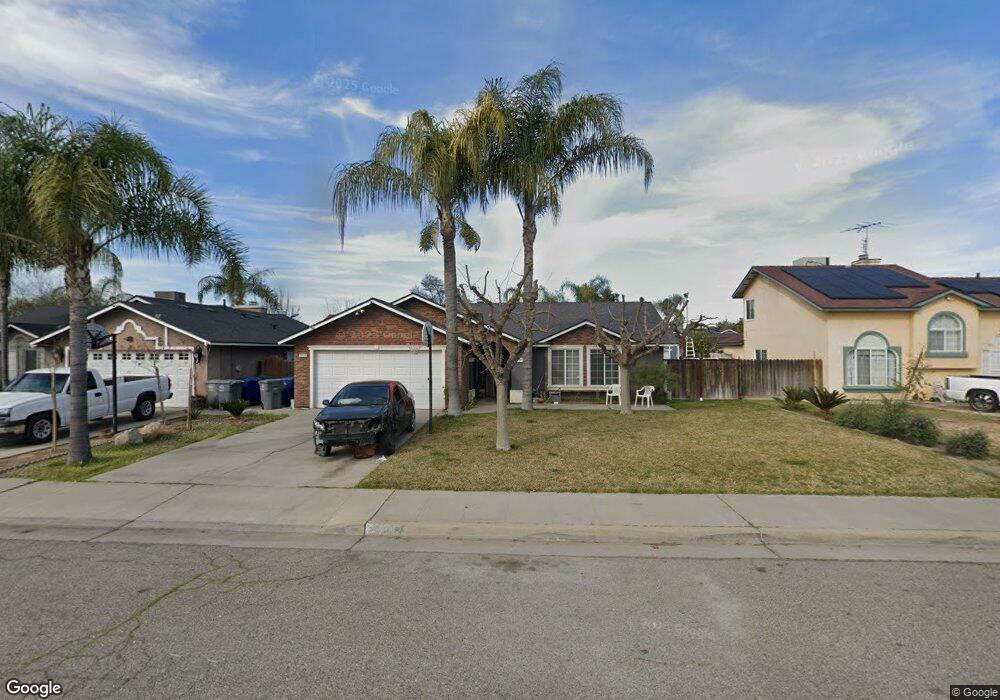
This home is located at 2658 Fig St, Selma, CA 93662 and is currently estimated at $361,959, approximately $266 per square foot. 2658 Fig St is a home located in Fresno County with nearby schools including Eric White Elementary School, Abraham Lincoln Middle School, and Selma High School.
Ownership History
Date
Name
Owned For
Owner Type
Purchase Details
Closed on
Mar 4, 2003
Sold by
Vallejos David L
Bought by
Valenzuela Gilberto
Current Estimated Value
Home Financials for this Owner
Home Financials are based on the most recent Mortgage that was taken out on this home.
Original Mortgage
$111,200
Outstanding Balance
$47,630
Interest Rate
5.83%
Estimated Equity
$314,329
Purchase Details
Closed on
Jun 13, 1997
Sold by
Vallejos Plechette
Bought by
Vallejos David L
Home Financials for this Owner
Home Financials are based on the most recent Mortgage that was taken out on this home.
Original Mortgage
$49,000
Interest Rate
7.5%
Create a Home Valuation Report for This Property
The Home Valuation Report is an in-depth analysis detailing your home's value as well as a comparison with similar homes in the area
Home Values in the Area
Average Home Value in this Area
Purchase History
| Date | Buyer | Sale Price | Title Company |
|---|---|---|---|
| Valenzuela Gilberto | $139,000 | Financial Title Company | |
| Vallejos David L | -- | First American Title Co |
Source: Public Records
Mortgage History
| Date | Status | Borrower | Loan Amount |
|---|---|---|---|
| Open | Valenzuela Gilberto | $111,200 | |
| Previous Owner | Vallejos David L | $49,000 |
Source: Public Records
Tax History
| Year | Tax Paid | Tax Assessment Tax Assessment Total Assessment is a certain percentage of the fair market value that is determined by local assessors to be the total taxable value of land and additions on the property. | Land | Improvement |
|---|---|---|---|---|
| 2025 | $3,389 | $201,299 | $43,440 | $157,859 |
| 2023 | $2,848 | $193,484 | $41,754 | $151,730 |
| 2022 | $3,119 | $189,691 | $40,936 | $148,755 |
| 2021 | $3,045 | $185,973 | $40,134 | $145,839 |
| 2020 | $3,014 | $184,067 | $39,723 | $144,344 |
| 2019 | $2,935 | $180,459 | $38,945 | $141,514 |
| 2018 | $2,768 | $168,300 | $51,000 | $117,300 |
| 2017 | $2,683 | $165,000 | $50,000 | $115,000 |
| 2016 | $2,302 | $150,000 | $50,000 | $100,000 |
| 2015 | $2,361 | $150,000 | $35,000 | $115,000 |
| 2014 | $2,380 | $154,300 | $33,200 | $121,100 |
Source: Public Records
Map
Nearby Homes
- 2022 Bauder St
- 2772 Valley View St
- 2116 Sylvia St
- 2662 Yerba St
- 2561 Stillman St Unit 111
- 2510 Whitson St
- 2753 Thompson Ave
- 2226 Arrants St
- 2126 Tulare St
- 2629 Mccall Ave
- 2766 Lee St
- 2221 Floral Ave
- 2002 Merced St
- 12623 S Mccall Ave
- 12615 S Mitchell Ave
- 1517 Stillman St
- 1361 Almond St
- 2580 Jackson St
- 2222 Barbara St
- 12778 S Mccall Ave