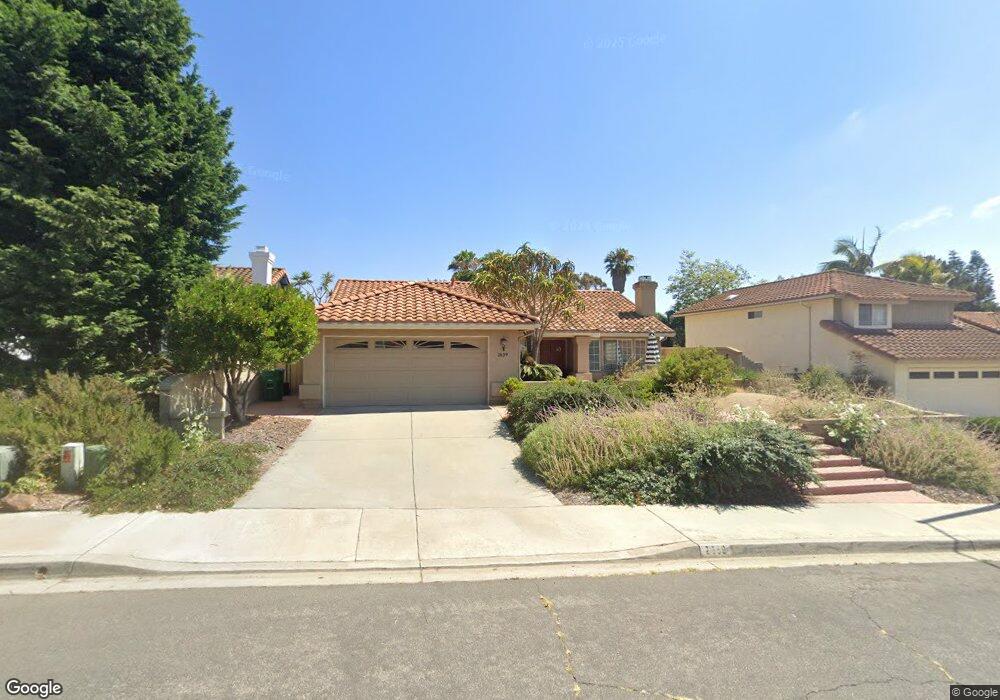
2659 Sutter St Unit 1 Carlsbad, CA 92010
Tamarack Point NeighborhoodEstimated Value: $1,292,399 - $1,461,000
4
Beds
2
Baths
1,797
Sq Ft
$775/Sq Ft
Est. Value
About This Home
This home is located at 2659 Sutter St Unit 1, Carlsbad, CA 92010 and is currently estimated at $1,392,100, approximately $774 per square foot. 2659 Sutter St Unit 1 is a home located in San Diego County with nearby schools including Hope Elementary School, Calavera Hills Middle, and Carlsbad High School.
Ownership History
Date
Name
Owned For
Owner Type
Purchase Details
Closed on
Jun 12, 2001
Sold by
Dressler John and Dressler Carol
Bought by
Landau Craig A and Venolia Leslie K
Current Estimated Value
Home Financials for this Owner
Home Financials are based on the most recent Mortgage that was taken out on this home.
Original Mortgage
$275,000
Outstanding Balance
$105,288
Interest Rate
7.21%
Estimated Equity
$1,286,812
Purchase Details
Closed on
Oct 4, 1993
Sold by
Dressler John and Dressler Carol
Bought by
Dressler John Charles and Dressler Carol Ann
Home Financials for this Owner
Home Financials are based on the most recent Mortgage that was taken out on this home.
Original Mortgage
$120,800
Interest Rate
4.75%
Purchase Details
Closed on
Nov 24, 1986
Create a Home Valuation Report for This Property
The Home Valuation Report is an in-depth analysis detailing your home's value as well as a comparison with similar homes in the area
Home Values in the Area
Average Home Value in this Area
Purchase History
| Date | Buyer | Sale Price | Title Company |
|---|---|---|---|
| Landau Craig A | $372,000 | First American Title | |
| Dressler John Charles | -- | United Title Company | |
| -- | $158,000 | -- |
Source: Public Records
Mortgage History
| Date | Status | Borrower | Loan Amount |
|---|---|---|---|
| Open | Landau Craig A | $275,000 | |
| Previous Owner | Dressler John Charles | $120,800 |
Source: Public Records
Tax History Compared to Growth
Tax History
| Year | Tax Paid | Tax Assessment Tax Assessment Total Assessment is a certain percentage of the fair market value that is determined by local assessors to be the total taxable value of land and additions on the property. | Land | Improvement |
|---|---|---|---|---|
| 2025 | $5,718 | $549,534 | $369,316 | $180,218 |
| 2024 | $5,718 | $538,760 | $362,075 | $176,685 |
| 2023 | $5,687 | $528,197 | $354,976 | $173,221 |
| 2022 | $5,598 | $517,841 | $348,016 | $169,825 |
| 2021 | $5,555 | $507,689 | $341,193 | $166,496 |
| 2020 | $5,517 | $502,484 | $337,695 | $164,789 |
| 2019 | $5,417 | $492,632 | $331,074 | $161,558 |
| 2018 | $5,187 | $482,974 | $324,583 | $158,391 |
| 2017 | $92 | $473,505 | $318,219 | $155,286 |
| 2016 | $4,894 | $464,222 | $311,980 | $152,242 |
| 2015 | $4,873 | $457,250 | $307,294 | $149,956 |
| 2014 | $4,791 | $448,294 | $301,275 | $147,019 |
Source: Public Records
Map
Nearby Homes
- 4350 Point Reyes Ct
- 4459 Dorchester Place
- 4439 Salisbury Dr
- 4375 Stanford St
- 2591 Regent Rd Unit 52
- 4405 Sierra Morena Ave
- 4583 Chancery Ct
- 4427 Trieste Dr
- 3485 Corvallis St
- 2543 Glasgow Dr
- 3920 Holly Brae Ln
- 2754 Inverness Dr
- 2880 Englewood Way
- 4847 Nelson Ct
- 2722 Olympia Dr
- 3442 Celinda Dr
- 3736 Donna Ct
- 2572 Chamomile Ln
- Plan 2212 Modeled at Coral Springs
- 4654 Catmint Ln
- 2655 Sutter St
- 2649 Sutter St
- 2669 Sutter St Unit 1
- 2645 Brighton Rd Unit 1
- 2649 Brighton Rd Unit 1
- 2653 Brighton Rd Unit 1
- 2675 Sutter St
- 2645 Sutter St
- 2641 Brighton Rd
- 2660 Sutter St
- 2668 Sutter St
- 2657 Brighton Rd
- 2654 Sutter St Unit 1
- 2679 Sutter St
- 2672 Sutter St
- 2648 Sutter St
- 2633 Banbury Ct
- 2637 Banbury Ct
- 2661 Brighton Rd
- 2629 Banbury Ct