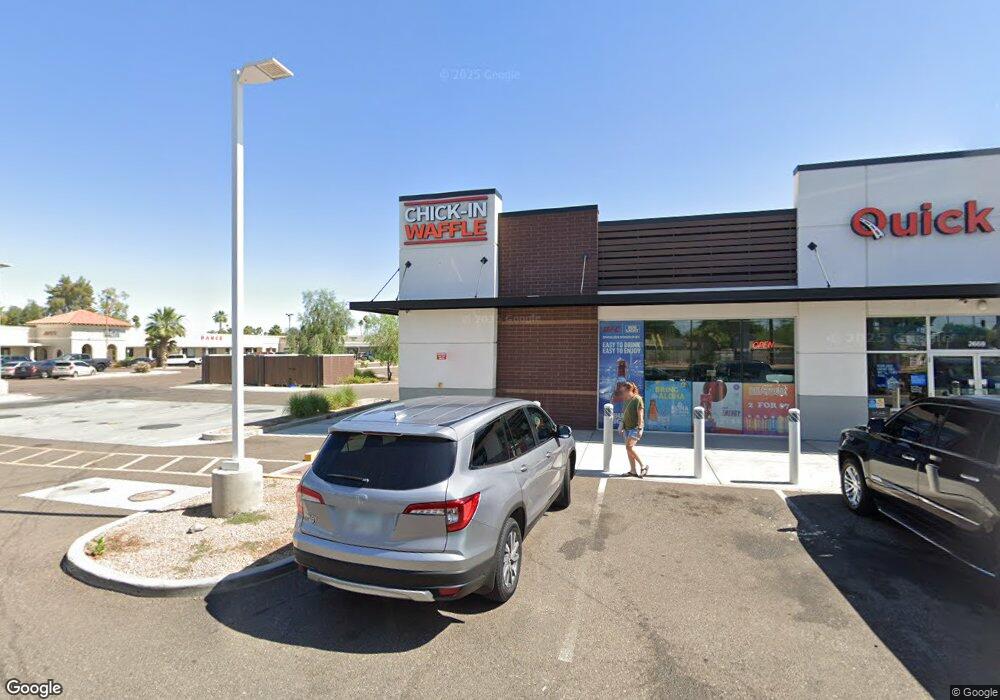
2659 W Guadalupe Rd Unit C Mesa, AZ 85202
Dobson NeighborhoodEstimated Value: $6,018,172
--
Bed
--
Bath
7,631
Sq Ft
$789/Sq Ft
Est. Value
About This Home
This home is located at 2659 W Guadalupe Rd Unit C, Mesa, AZ 85202 and is currently estimated at $6,018,172, approximately $788 per square foot. 2659 W Guadalupe Rd Unit C is a home located in Maricopa County with nearby schools including Franklin at Brimhall Elementary School, Franklin Accelerated Academy Jordan Campus, and Washington Elementary School.
Ownership History
Date
Name
Owned For
Owner Type
Purchase Details
Closed on
Aug 27, 2021
Sold by
Gemcap Development Llc
Bought by
Cf Realty Llc
Current Estimated Value
Home Financials for this Owner
Home Financials are based on the most recent Mortgage that was taken out on this home.
Original Mortgage
$3,862,950
Outstanding Balance
$3,514,997
Interest Rate
2.8%
Mortgage Type
Commercial
Estimated Equity
$2,503,175
Purchase Details
Closed on
Jan 13, 2020
Sold by
Jlt Office Complex Llc
Bought by
Gemcap Development Llc
Purchase Details
Closed on
Aug 23, 2000
Sold by
Toppenberg Larry W and Toppenberg June M
Bought by
Jlt Office Complex Llc
Purchase Details
Closed on
Apr 21, 1994
Sold by
Blackwell Investment Co Inc
Bought by
Toppenberg Larry W and Toppenberg June M
Home Financials for this Owner
Home Financials are based on the most recent Mortgage that was taken out on this home.
Original Mortgage
$166,250
Interest Rate
7.84%
Mortgage Type
Commercial
Create a Home Valuation Report for This Property
The Home Valuation Report is an in-depth analysis detailing your home's value as well as a comparison with similar homes in the area
Home Values in the Area
Average Home Value in this Area
Purchase History
| Date | Buyer | Sale Price | Title Company |
|---|---|---|---|
| Cf Realty Llc | $5,867,319 | Chicago Title | |
| Gemcap Development Llc | $885,000 | Fidelity National Title | |
| Jlt Office Complex Llc | -- | -- | |
| Toppenberg Larry W | $237,500 | Lawyers Title |
Source: Public Records
Mortgage History
| Date | Status | Borrower | Loan Amount |
|---|---|---|---|
| Open | Cf Realty Llc | $3,862,950 | |
| Previous Owner | Toppenberg Larry W | $166,250 |
Source: Public Records
Tax History Compared to Growth
Tax History
| Year | Tax Paid | Tax Assessment Tax Assessment Total Assessment is a certain percentage of the fair market value that is determined by local assessors to be the total taxable value of land and additions on the property. | Land | Improvement |
|---|---|---|---|---|
| 2025 | $20,026 | $202,978 | -- | -- |
| 2024 | $21,342 | $199,354 | -- | -- |
| 2023 | $21,342 | $273,258 | $103,479 | $169,779 |
| 2022 | $21,515 | $262,710 | $107,905 | $154,805 |
| 2021 | $20,317 | $240,354 | $110,988 | $129,366 |
| 2020 | $20,052 | $206,658 | $106,380 | $100,278 |
| 2019 | $18,735 | $174,708 | $93,942 | $80,766 |
| 2018 | $17,981 | $172,494 | $100,638 | $71,856 |
| 2017 | $17,445 | $158,688 | $93,186 | $65,502 |
| 2016 | $17,121 | $133,506 | $83,214 | $50,292 |
| 2015 | $17,504 | $144,023 | $54,594 | $89,429 |
Source: Public Records
Map
Nearby Homes
- 2642 W Onza Ave
- 2559 W Olla Cir
- 6320 S Shannon Dr Unit 9
- 6411 S River Dr Unit 6
- 6411 S River Dr Unit 38
- 2453 W Pecos Ave
- 2628 W Mendoza Cir
- 2552 S Playa
- 2115 E Vaughn St
- 5817 S Siesta Ln
- 5727 S Siesta Ln
- 2309 W Naranja Ave
- 2036 E Gemini Dr
- 2051 E Vaughn St
- 2031 E Vaughn St
- 2140 E Apollo Ave
- 2016 E Redmon Dr
- 2811 W Rosewood Dr
- 2334 W Peralta Ave
- 5401 S Siesta Ln
- 2659 W Guadalupe Rd Unit D
- 2653 W Guadalupe Rd
- 2651 W Guadalupe Rd
- 2645 W Naranja Ave
- 2655 W Naranja Ave
- 2635 W Naranja Ave Unit 6
- 2663 W Naranja Ave
- 2848 S Carriage Ln
- 2655 W Guadalupe Rd
- 2625 W Naranja Ave
- 2852 S Carriage Ln
- 2852 S Carriage Ln
- 2614 W Olla Cir
- 2605 W Naranja Ave
- 2615 W Naranja Ave
- 2650 W Naranja Ave
- 2634 W Naranja Ave
- 2608 W Olla Cir
- 2658 W Naranja Ave