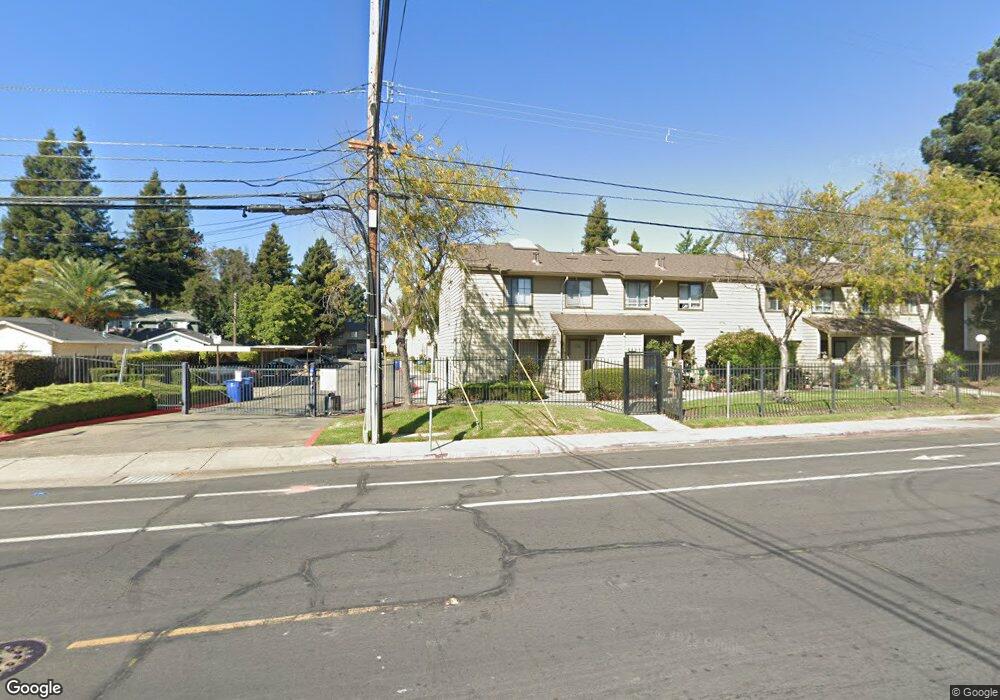
26590 Sunvale Ct Hayward, CA 94544
Harder-Tennyson NeighborhoodEstimated Value: $555,000 - $582,814
3
Beds
2
Baths
1,200
Sq Ft
$473/Sq Ft
Est. Value
About This Home
This home is located at 26590 Sunvale Ct, Hayward, CA 94544 and is currently estimated at $567,954, approximately $473 per square foot. 26590 Sunvale Ct is a home located in Alameda County with nearby schools including Glassbrook Elementary School, Martin Luther King, Jr. Middle School, and Tennyson High School.
Ownership History
Date
Name
Owned For
Owner Type
Purchase Details
Closed on
Nov 13, 2018
Sold by
Portillano Criza
Bought by
Gonzales Viray Rudolph A and Gonzales Calderon Anna Lorraine
Current Estimated Value
Home Financials for this Owner
Home Financials are based on the most recent Mortgage that was taken out on this home.
Original Mortgage
$427,500
Outstanding Balance
$375,132
Interest Rate
4.7%
Mortgage Type
New Conventional
Estimated Equity
$192,822
Purchase Details
Closed on
Dec 20, 2016
Sold by
Portillano Criza and Asuncion Criza M
Bought by
Portillano Criza
Home Financials for this Owner
Home Financials are based on the most recent Mortgage that was taken out on this home.
Original Mortgage
$268,000
Interest Rate
3.94%
Mortgage Type
New Conventional
Purchase Details
Closed on
Dec 19, 2012
Sold by
Mirkarimi Shahriar
Bought by
Asuncion Criza M
Home Financials for this Owner
Home Financials are based on the most recent Mortgage that was taken out on this home.
Original Mortgage
$133,000
Interest Rate
3.27%
Mortgage Type
New Conventional
Purchase Details
Closed on
Feb 25, 2009
Sold by
Federal Deposit Insurance Corporation
Bought by
Jpmorgan Chase Bank National Association
Purchase Details
Closed on
Feb 22, 2009
Sold by
Jp Morgan Chase Bank National Associatio
Bought by
Mirkarimi Shahriar
Purchase Details
Closed on
May 29, 2008
Sold by
Tombossa Freweini W
Bought by
Washington Mutual Bank
Purchase Details
Closed on
Oct 30, 2006
Sold by
Masood Ebrahim
Bought by
Tombossa Freweini W
Home Financials for this Owner
Home Financials are based on the most recent Mortgage that was taken out on this home.
Original Mortgage
$130,000
Interest Rate
6.36%
Mortgage Type
Credit Line Revolving
Purchase Details
Closed on
Mar 25, 2003
Sold by
King Marie L
Bought by
Tombossa Freweini W
Home Financials for this Owner
Home Financials are based on the most recent Mortgage that was taken out on this home.
Original Mortgage
$243,000
Interest Rate
6.87%
Mortgage Type
Purchase Money Mortgage
Purchase Details
Closed on
Oct 21, 1999
Sold by
English Lucille G
Bought by
King Marie L
Home Financials for this Owner
Home Financials are based on the most recent Mortgage that was taken out on this home.
Original Mortgage
$150,400
Interest Rate
7.75%
Mortgage Type
FHA
Create a Home Valuation Report for This Property
The Home Valuation Report is an in-depth analysis detailing your home's value as well as a comparison with similar homes in the area
Home Values in the Area
Average Home Value in this Area
Purchase History
| Date | Buyer | Sale Price | Title Company |
|---|---|---|---|
| Gonzales Viray Rudolph A | $450,000 | Old Republic Title Company | |
| Portillano Criza | -- | Title 365 Company | |
| Portillano Criza | -- | Title 365 Company | |
| Asuncion Criza M | $140,000 | Old Republic Title Company | |
| Jpmorgan Chase Bank National Association | -- | Chicago Title Company | |
| Mirkarimi Shahriar | $150,000 | Chicago Title Company | |
| Washington Mutual Bank | $241,277 | None Available | |
| Tombossa Freweini W | -- | Financial Title Company | |
| Tombossa Freweini W | $270,000 | Alliance Title Company | |
| King Marie L | $155,500 | Financial Title Company |
Source: Public Records
Mortgage History
| Date | Status | Borrower | Loan Amount |
|---|---|---|---|
| Open | Gonzales Viray Rudolph A | $427,500 | |
| Previous Owner | Portillano Criza | $268,000 | |
| Previous Owner | Asuncion Criza M | $133,000 | |
| Previous Owner | Tombossa Freweini W | $130,000 | |
| Previous Owner | Tombossa Freweini W | $243,000 | |
| Previous Owner | King Marie L | $150,400 | |
| Closed | King Marie L | $7,755 |
Source: Public Records
Tax History Compared to Growth
Tax History
| Year | Tax Paid | Tax Assessment Tax Assessment Total Assessment is a certain percentage of the fair market value that is determined by local assessors to be the total taxable value of land and additions on the property. | Land | Improvement |
|---|---|---|---|---|
| 2025 | $6,119 | $494,974 | $150,592 | $351,382 |
| 2024 | $6,119 | $485,133 | $147,640 | $344,493 |
| 2023 | $6,027 | $482,484 | $144,745 | $337,739 |
| 2022 | $5,910 | $466,025 | $141,907 | $331,118 |
| 2021 | $5,861 | $456,751 | $139,125 | $324,626 |
| 2020 | $5,796 | $459,000 | $137,700 | $321,300 |
| 2019 | $5,842 | $450,000 | $135,000 | $315,000 |
| 2018 | $2,151 | $151,514 | $45,454 | $106,060 |
| 2017 | $2,107 | $148,543 | $44,563 | $103,980 |
| 2016 | $1,972 | $145,631 | $43,689 | $101,942 |
| 2015 | $1,937 | $143,444 | $43,033 | $100,411 |
| 2014 | $1,851 | $140,634 | $42,190 | $98,444 |
Source: Public Records
Map
Nearby Homes
- 399 Schafer Rd
- 250 Schafer Rd
- 26361 Huntwood Ave
- 318 Dumont Ave
- 26231 Gamboa St
- 1021 Cheryl Ann Cir Unit 62
- 1029 Cheryl Ann Cir Unit 66
- 26555 Underwood Ave
- 26047 Gading Rd
- 1235 Westwood St
- 27418 Susan Place Unit 3
- 1338 Thais Ln
- 26132 Jane Ave
- 27505 Tampa Ave Unit 15
- 725 Auburn Place Unit 106
- 27426 Patrick Ave
- 27639 Eucalyptus Ct
- 1050 Forselles Way
- 1481 Rieger Ave
- 25478 Huntwood Ave Unit 18
- 26588 Sunvale Ct Unit 26
- 26598 Sunvale Ct
- 26594 Sunvale Ct
- 26564 Sunvale Ct
- 26584 Sunvale Ct Unit 24
- 26580 Sunvale Ct
- 26576 Sunvale Ct
- 26568 Sunvale Ct Unit 20
- 26572 Sunvale Ct
- 711 Schafer Rd
- 692 Schafer Rd
- 708 Schafer Rd
- 26560 Sunvale Ct
- 26554 Sunvale Ct
- 26550 Sunvale Ct
- 26546 Sunvale Ct
- 684 -686 Schafer
- 684 Schafer Rd
- 625 Schafer Rd
- 734 Schafer Rd