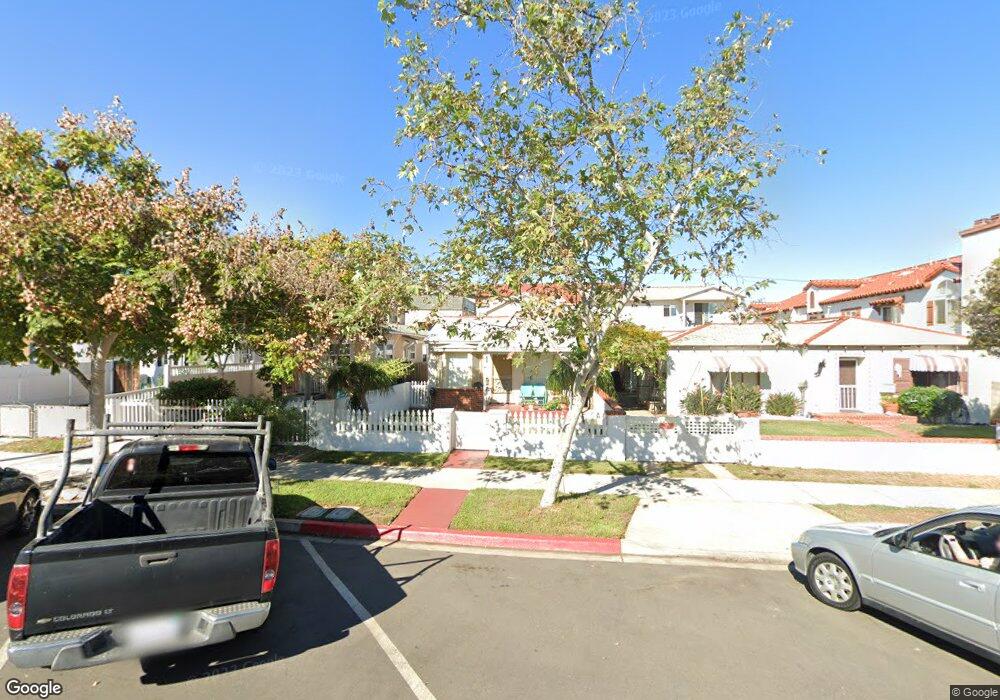
266 C Ave Coronado, CA 92118
Estimated Value: $1,587,000 - $1,878,000
2
Beds
1
Bath
865
Sq Ft
$1,925/Sq Ft
Est. Value
About This Home
This home is located at 266 C Ave, Coronado, CA 92118 and is currently estimated at $1,665,265, approximately $1,925 per square foot. 266 C Ave is a home located in San Diego County with nearby schools including Coronado Village Elementary, Coronado Middle School, and Coronado High School.
Ownership History
Date
Name
Owned For
Owner Type
Purchase Details
Closed on
Feb 24, 2012
Sold by
Halloran Michael D and Halloran Michael D
Bought by
Halloran Michael D and Halloran Yolanda D
Current Estimated Value
Purchase Details
Closed on
Dec 16, 2010
Sold by
Halloran Michael
Bought by
Halloran Michael
Purchase Details
Closed on
Jul 18, 2006
Sold by
Halloran Michael
Bought by
Halloran Michael
Purchase Details
Closed on
Mar 20, 2006
Sold by
Halloran Rita K
Bought by
Halloran Michael
Create a Home Valuation Report for This Property
The Home Valuation Report is an in-depth analysis detailing your home's value as well as a comparison with similar homes in the area
Home Values in the Area
Average Home Value in this Area
Purchase History
| Date | Buyer | Sale Price | Title Company |
|---|---|---|---|
| Halloran Michael D | -- | None Available | |
| Halloran Michael | -- | None Available | |
| Halloran Michael | -- | None Available | |
| Halloran Michael | -- | None Available |
Source: Public Records
Tax History
| Year | Tax Paid | Tax Assessment Tax Assessment Total Assessment is a certain percentage of the fair market value that is determined by local assessors to be the total taxable value of land and additions on the property. | Land | Improvement |
|---|---|---|---|---|
| 2025 | $4,085 | $333,587 | $36,706 | $296,881 |
| 2024 | $4,085 | $327,047 | $35,987 | $291,060 |
| 2023 | $4,017 | $320,635 | $35,282 | $285,353 |
| 2022 | $3,951 | $314,349 | $34,591 | $279,758 |
| 2021 | $3,900 | $308,186 | $33,913 | $274,273 |
| 2020 | $3,806 | $305,027 | $33,566 | $271,461 |
| 2019 | $3,795 | $299,047 | $32,908 | $266,139 |
| 2018 | $3,738 | $293,184 | $32,263 | $260,921 |
| 2017 | $3,646 | $287,436 | $31,631 | $255,805 |
| 2016 | $3,513 | $281,801 | $31,011 | $250,790 |
| 2015 | $3,431 | $277,569 | $30,546 | $247,023 |
| 2014 | $3,320 | $272,133 | $29,948 | $242,185 |
Source: Public Records
Map
Nearby Homes
Your Personal Tour Guide
Ask me questions while you tour the home.