266 Chaparral Cir Unit 11I Elgin, IL 60120
Bluff City NeighborhoodEstimated Value: $272,000 - $293,000
3
Beds
2
Baths
1,208
Sq Ft
$236/Sq Ft
Est. Value
About This Home
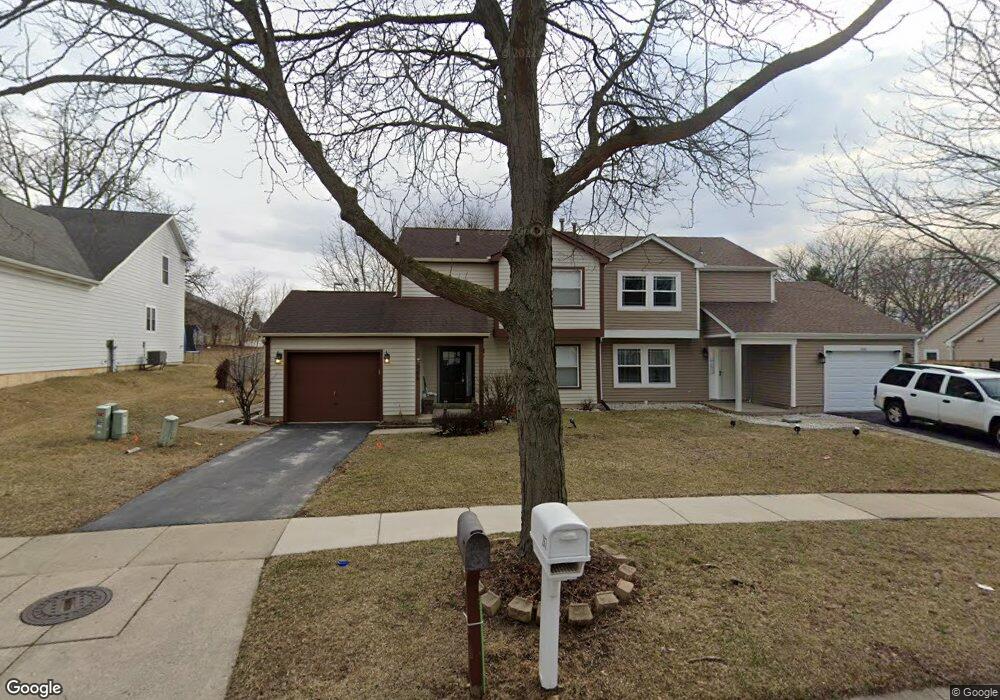
This home is located at 266 Chaparral Cir Unit 11I, Elgin, IL 60120 and is currently estimated at $284,579, approximately $235 per square foot. 266 Chaparral Cir Unit 11I is a home located in Cook County with nearby schools including Hilltop Elementary School, Ellis Middle School, and Elgin High School.
Ownership History
Date
Name
Owned For
Owner Type
Purchase Details
Closed on
Dec 3, 2001
Sold by
Ocampo Maria I
Bought by
Diaz Maria P
Current Estimated Value
Purchase Details
Closed on
Aug 28, 2000
Sold by
Velasquez Cecilio
Bought by
Ocampos Maria L
Purchase Details
Closed on
Aug 29, 1997
Sold by
Knodle Jeffrey C and Knodle Evelyn M
Bought by
Velaszquez Cecilio and Ocampo Maria I
Home Financials for this Owner
Home Financials are based on the most recent Mortgage that was taken out on this home.
Original Mortgage
$92,070
Interest Rate
7.55%
Create a Home Valuation Report for This Property
The Home Valuation Report is an in-depth analysis detailing your home's value as well as a comparison with similar homes in the area
Home Values in the Area
Average Home Value in this Area
Purchase History
| Date | Buyer | Sale Price | Title Company |
|---|---|---|---|
| Diaz Maria P | $100,000 | Chicago Title Insurance Comp | |
| Diaz Maria P | $100,000 | Chicago Title Insurance Comp | |
| Ocampos Maria L | -- | -- | |
| Velaszquez Cecilio | $66,000 | -- |
Source: Public Records
Mortgage History
| Date | Status | Borrower | Loan Amount |
|---|---|---|---|
| Previous Owner | Velaszquez Cecilio | $92,070 |
Source: Public Records
Tax History Compared to Growth
Tax History
| Year | Tax Paid | Tax Assessment Tax Assessment Total Assessment is a certain percentage of the fair market value that is determined by local assessors to be the total taxable value of land and additions on the property. | Land | Improvement |
|---|---|---|---|---|
| 2024 | $4,136 | $21,000 | $3,000 | $18,000 |
| 2023 | $4,918 | $21,000 | $3,000 | $18,000 |
| 2022 | $4,918 | $21,000 | $3,000 | $18,000 |
| 2021 | $3,536 | $13,591 | $2,814 | $10,777 |
| 2020 | $3,592 | $13,591 | $2,814 | $10,777 |
| 2019 | $3,629 | $15,271 | $2,814 | $12,457 |
| 2018 | $3,252 | $13,006 | $2,412 | $10,594 |
| 2017 | $3,262 | $13,006 | $2,412 | $10,594 |
| 2016 | $3,349 | $13,006 | $2,412 | $10,594 |
| 2015 | $3,223 | $11,797 | $2,144 | $9,653 |
| 2014 | $3,140 | $11,797 | $2,144 | $9,653 |
| 2013 | $2,399 | $11,797 | $2,144 | $9,653 |
Source: Public Records
Map
Nearby Homes
- 1373 Cimarron Ct Unit 49
- 26 Glen Echo Rd
- 1320 Aspen Ct
- 1478 Keystone Ct Unit 582
- 1533 Keystone Ct Unit 414
- 468 Littleton Trail Unit 403
- 727 Littleton Trail Unit 505
- 1366 Inverness Dr
- 1292 Inverness Dr
- 1104 Yorkshire Ct Unit B
- 1107 Yorkshire Ct Unit B
- 130 Stonehurst Dr
- 103 Fawn Ln
- 1023 Berkshire Ct Unit C
- 104 Gloria Dr
- 700 Mariner Dr
- 110 Gloria Dr
- 112 Gloria Dr
- 1103 Nottingham Ln
- 1002 Bruce Dr
- 268 Chaparral Cir Unit 11II
- 262 Chaparral Cir
- 272 Chaparral Cir Unit 121
- 254 Chaparral Cir Unit 92
- 274 Chaparral Cir Unit 12II
- 267 Chaparral Cir Unit 371
- 252 Chaparral Cir Unit 91
- 280 Chaparral Cir Unit 131
- 269 Chaparral Cir
- 255 Chaparral Cir Unit 36II
- 281 Chaparral Cir Unit 381
- 248 Chaparral Cir Unit 82
- 253 Chaparral Cir Unit 361
- 282 Chaparral Cir Unit 132
- 283 Chaparral Cir Unit 382
- 286 Chaparral Cir Unit 141
- 246 Chaparral Cir Unit 81
- 1387 Cimarron Ct Unit 5111
- 1391 Cimarron Ct Unit 521
- 287 Chaparral Cir Unit 39