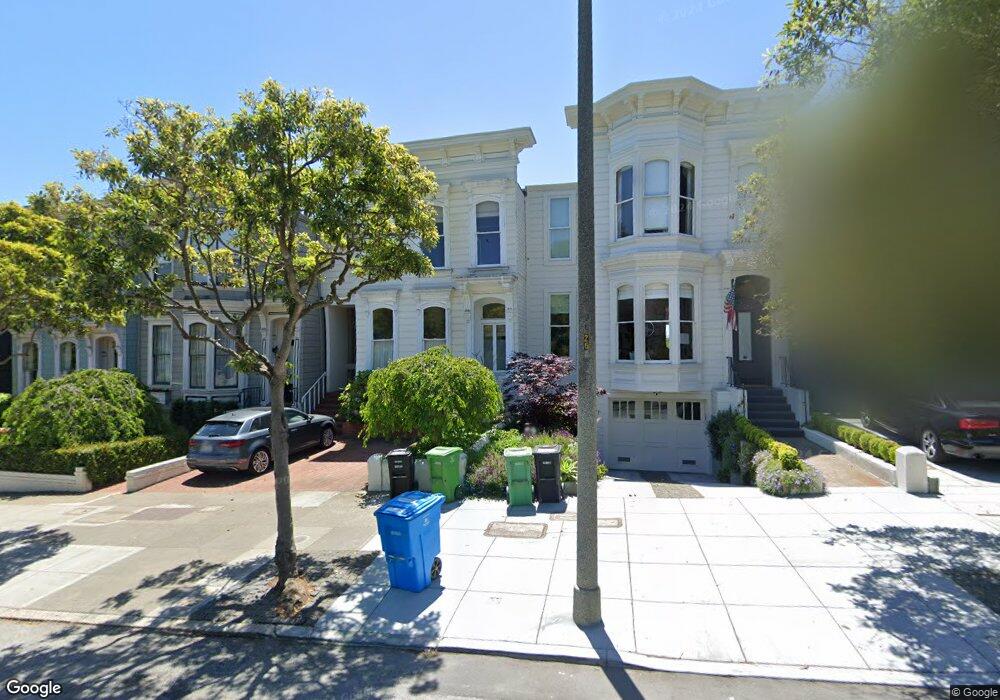
2661 Clay St San Francisco, CA 94115
Pacific Heights NeighborhoodEstimated Value: $2,443,000 - $5,253,000
3
Beds
4
Baths
1,300
Sq Ft
$3,163/Sq Ft
Est. Value
About This Home
This home is located at 2661 Clay St, San Francisco, CA 94115 and is currently estimated at $4,112,369, approximately $3,163 per square foot. 2661 Clay St is a home located in San Francisco County with nearby schools including Cobb (William L.) Elementary School, Roosevelt Middle School, and Mary L. Booker Leadership Academy.
Ownership History
Date
Name
Owned For
Owner Type
Purchase Details
Closed on
May 21, 2010
Sold by
Harris G Parker and Johnson Holly L
Bought by
Almqvist Carl Magnus Holger and Funes Elda Rosa Checa
Current Estimated Value
Home Financials for this Owner
Home Financials are based on the most recent Mortgage that was taken out on this home.
Original Mortgage
$1,500,000
Outstanding Balance
$930,062
Interest Rate
3.65%
Mortgage Type
New Conventional
Estimated Equity
$3,182,307
Purchase Details
Closed on
Aug 23, 1999
Sold by
Goldstein Sydney
Bought by
Harris G Parker and Johnson Holly L
Home Financials for this Owner
Home Financials are based on the most recent Mortgage that was taken out on this home.
Original Mortgage
$900,000
Interest Rate
5.25%
Mortgage Type
Stand Alone First
Create a Home Valuation Report for This Property
The Home Valuation Report is an in-depth analysis detailing your home's value as well as a comparison with similar homes in the area
Home Values in the Area
Average Home Value in this Area
Purchase History
| Date | Buyer | Sale Price | Title Company |
|---|---|---|---|
| Almqvist Carl Magnus Holger | $2,800,000 | Chicago Title Company | |
| Harris G Parker | $1,825,000 | Fidelity National Title Co |
Source: Public Records
Mortgage History
| Date | Status | Borrower | Loan Amount |
|---|---|---|---|
| Open | Almqvist Carl Magnus Holger | $1,500,000 | |
| Previous Owner | Harris G Parker | $900,000 | |
| Closed | Harris G Parker | $380,000 |
Source: Public Records
Tax History Compared to Growth
Tax History
| Year | Tax Paid | Tax Assessment Tax Assessment Total Assessment is a certain percentage of the fair market value that is determined by local assessors to be the total taxable value of land and additions on the property. | Land | Improvement |
|---|---|---|---|---|
| 2025 | $42,216 | $3,614,280 | $2,530,000 | $1,084,280 |
| 2024 | $42,216 | $3,543,414 | $2,480,394 | $1,063,020 |
| 2023 | $41,596 | $3,473,938 | $2,431,760 | $1,042,178 |
| 2022 | $40,830 | $3,405,824 | $2,384,080 | $1,021,744 |
| 2021 | $40,115 | $3,339,044 | $2,337,334 | $1,001,710 |
| 2020 | $40,263 | $3,304,808 | $2,313,368 | $991,440 |
| 2019 | $38,873 | $3,240,008 | $2,268,008 | $972,000 |
| 2018 | $37,560 | $3,176,480 | $2,223,538 | $952,942 |
| 2017 | $36,818 | $3,114,198 | $2,179,940 | $934,258 |
| 2016 | $36,272 | $3,053,138 | $2,137,198 | $915,940 |
| 2015 | $35,827 | $3,007,278 | $2,105,096 | $902,182 |
| 2014 | $34,879 | $2,948,372 | $2,063,862 | $884,510 |
Source: Public Records
Map
Nearby Homes
- 2678 Sacramento St
- 2760 Sacramento St Unit 12
- 2539 Clay St Unit 1
- 2051 Scott St Unit 101
- 2500 Steiner St Unit 3
- 2467 Pacific Ave
- 2121 Webster St Unit GPH1
- 2232 Bush St
- 2020 Webster St
- 2829 California St Unit 2
- 2275 California St
- 2850 Jackson St
- 2185 Bush St Unit 206
- 2215 California St
- 2800 Pacific Ave
- 2075 Sutter St Unit 215
- 2755 Fillmore St
- 2109 Bush St
- 2070 Bush St
- 2654-2656 Bush St
- 2667 Clay St
- 2655 Clay St
- 2673 Clay St
- 2649 Clay St
- 2643 Clay St
- 2637 Clay St
- 2134 Pierce St
- 2136 Pierce St Unit 2138
- 2126 Pierce St
- 2618 Sacramento St
- 2631 Clay St
- 2120 Pierce St Unit 2122
- 2130 Pierce St
- 2616 Sacramento St
- 2614 Sacramento St
- 2612 Sacramento St
- 2629 Clay St Unit 2629
- 2627 Clay St
- 2625 Clay St
- 2672 Sacramento St