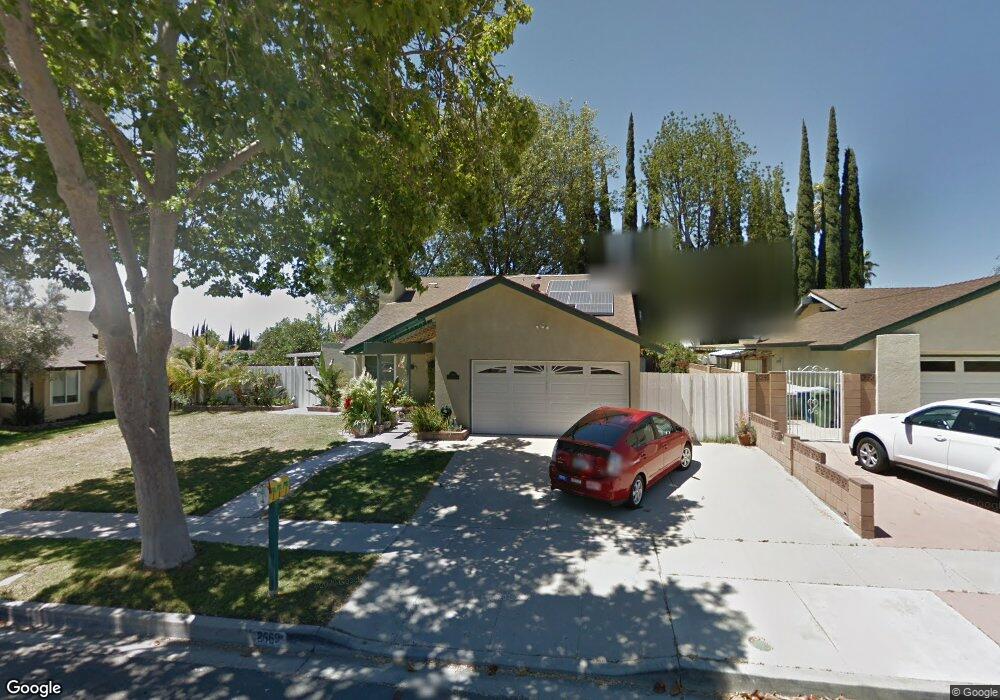
2669 N Woodrow Ave Simi Valley, CA 93065
Central Simi Valley NeighborhoodEstimated Value: $831,528 - $902,000
4
Beds
3
Baths
1,781
Sq Ft
$493/Sq Ft
Est. Value
About This Home
This home is located at 2669 N Woodrow Ave, Simi Valley, CA 93065 and is currently estimated at $878,382, approximately $493 per square foot. 2669 N Woodrow Ave is a home located in Ventura County with nearby schools including Atherwood Elementary School, Sinaloa Middle School, and Simi Valley High School.
Ownership History
Date
Name
Owned For
Owner Type
Purchase Details
Closed on
Mar 28, 2017
Sold by
Lawton Ronnetta L
Bought by
Lawton Ronnetta L
Current Estimated Value
Purchase Details
Closed on
Jul 26, 2016
Sold by
Lawton Ronetta L
Bought by
Lawton Ronnetta L
Purchase Details
Closed on
Jun 27, 2011
Sold by
Lawton Ronnetta L
Bought by
Lawton Ronnetta L
Purchase Details
Closed on
Dec 21, 2003
Sold by
Lawton Thomas Scott and Lawton Ronetta
Bought by
Lawton Thomas Scott and Lawton Ronetta L
Purchase Details
Closed on
Nov 13, 2001
Sold by
Greenberg Linda B
Bought by
Lawton Thomas Scott and Lawton Ronnetta
Home Financials for this Owner
Home Financials are based on the most recent Mortgage that was taken out on this home.
Original Mortgage
$223,000
Outstanding Balance
$86,581
Interest Rate
6.63%
Mortgage Type
Seller Take Back
Estimated Equity
$791,801
Create a Home Valuation Report for This Property
The Home Valuation Report is an in-depth analysis detailing your home's value as well as a comparison with similar homes in the area
Home Values in the Area
Average Home Value in this Area
Purchase History
| Date | Buyer | Sale Price | Title Company |
|---|---|---|---|
| Lawton Ronnetta L | -- | None Available | |
| Lawton Ronnetta L | -- | None Available | |
| Lawton Ronnetta L | -- | None Available | |
| Lawton Thomas Scott | -- | -- | |
| Lawton Thomas Scott | $238,000 | Lawyers Title Company |
Source: Public Records
Mortgage History
| Date | Status | Borrower | Loan Amount |
|---|---|---|---|
| Open | Lawton Thomas Scott | $223,000 |
Source: Public Records
Tax History Compared to Growth
Tax History
| Year | Tax Paid | Tax Assessment Tax Assessment Total Assessment is a certain percentage of the fair market value that is determined by local assessors to be the total taxable value of land and additions on the property. | Land | Improvement |
|---|---|---|---|---|
| 2025 | $4,497 | $351,570 | $140,624 | $210,946 |
| 2024 | $4,497 | $344,677 | $137,867 | $206,810 |
| 2023 | $4,226 | $337,919 | $135,164 | $202,755 |
| 2022 | $4,195 | $331,294 | $132,514 | $198,780 |
| 2021 | $4,151 | $324,799 | $129,916 | $194,883 |
| 2020 | $4,057 | $321,471 | $128,585 | $192,886 |
| 2019 | $3,870 | $315,168 | $126,064 | $189,104 |
| 2018 | $3,828 | $308,990 | $123,593 | $185,397 |
| 2017 | $3,736 | $302,932 | $121,170 | $181,762 |
| 2016 | $3,565 | $296,994 | $118,795 | $178,199 |
| 2015 | $3,483 | $292,534 | $117,011 | $175,523 |
| 2014 | $3,426 | $286,806 | $114,720 | $172,086 |
Source: Public Records
Map
Nearby Homes
- 2718 Licia Place
- 2719 Licia Place
- 2752 Wanda Ave
- 2679 Velma Ct
- 2442 N Alden St
- 2649 Nicholas St
- 2660 Tumbleweed Ave
- 2355 E Alden St
- 2320 Lupin St
- 2753 Deerwood Ave
- 2306 Madrone St
- 2410 N Justin Ave
- 2877 Avenida Simi
- 2269 Ravenna St
- 2213 Dogwood St
- 3028 Harrison Ln
- 2357 Lawnview Ct
- 3049 Reservoir Dr
- 2149 Clover St
- 2148 Stoneman St
- 2689 N Woodrow Ave
- 2653 N Woodrow Ave
- 2620 Lynwood St
- 2664 Gates Place
- 2631 N Woodrow Ave
- 2662 N Woodrow Ave
- 2610 Lynwood St
- 2678 N Woodrow Ave
- 2646 N Woodrow Ave
- 2642 Gates Place
- 2691 Gates Place
- 2707 N Woodrow Ave
- 2694 N Woodrow Ave
- 2628 N Woodrow Ave
- 2607 N Woodrow Ave
- 2708 Beth Place
- 2647 Night Jasmine Dr
- 2594 Lynwood St
- 2657 Night Jasmine Dr
- 2616 Gates Place