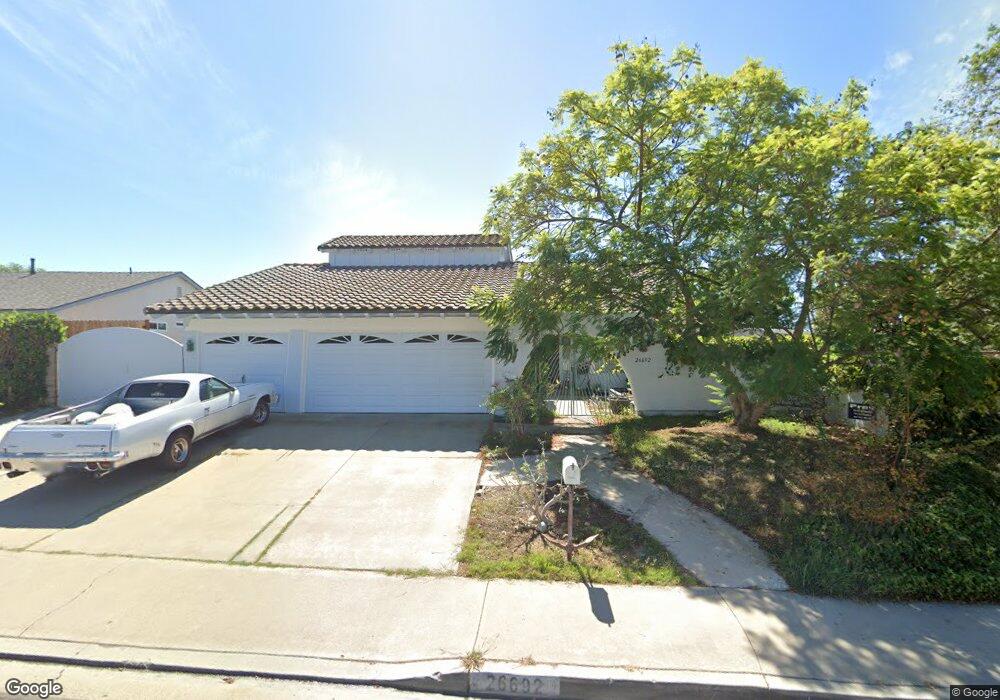
26692 Cadiz Cir Mission Viejo, CA 92691
Estimated Value: $1,778,000 - $2,152,000
3
Beds
3
Baths
3,266
Sq Ft
$602/Sq Ft
Est. Value
About This Home
This home is located at 26692 Cadiz Cir, Mission Viejo, CA 92691 and is currently estimated at $1,966,786, approximately $602 per square foot. 26692 Cadiz Cir is a home located in Orange County with nearby schools including Viejo Elementary School, Newhart Middle School, and Capistrano Valley High School.
Ownership History
Date
Name
Owned For
Owner Type
Purchase Details
Closed on
Oct 21, 2005
Sold by
Taylor Robert and Taylor Lisa J
Bought by
Taylor Robert and Taylor Lisa J
Current Estimated Value
Home Financials for this Owner
Home Financials are based on the most recent Mortgage that was taken out on this home.
Original Mortgage
$281,500
Interest Rate
5.68%
Mortgage Type
New Conventional
Purchase Details
Closed on
Jul 31, 2002
Sold by
Taylor Robert and Taylor Lisa J
Bought by
Taylor Robert and Taylor Lisa J
Home Financials for this Owner
Home Financials are based on the most recent Mortgage that was taken out on this home.
Original Mortgage
$270,000
Interest Rate
6.09%
Purchase Details
Closed on
Dec 27, 1996
Sold by
Taylor Robert C and Jayne Lisa Jayne
Bought by
Taylor Robert and Taylor Lisa J
Create a Home Valuation Report for This Property
The Home Valuation Report is an in-depth analysis detailing your home's value as well as a comparison with similar homes in the area
Home Values in the Area
Average Home Value in this Area
Purchase History
| Date | Buyer | Sale Price | Title Company |
|---|---|---|---|
| Taylor Robert | -- | Chicago Title Co | |
| Taylor Robert | -- | Equity Title | |
| Taylor Robert | -- | Equity Title | |
| Taylor Robert | -- | -- |
Source: Public Records
Mortgage History
| Date | Status | Borrower | Loan Amount |
|---|---|---|---|
| Closed | Taylor Robert | $281,500 | |
| Closed | Taylor Robert | $270,000 |
Source: Public Records
Tax History Compared to Growth
Tax History
| Year | Tax Paid | Tax Assessment Tax Assessment Total Assessment is a certain percentage of the fair market value that is determined by local assessors to be the total taxable value of land and additions on the property. | Land | Improvement |
|---|---|---|---|---|
| 2025 | $6,443 | $654,745 | $372,658 | $282,087 |
| 2024 | $6,443 | $641,907 | $365,351 | $276,556 |
| 2023 | $6,305 | $629,321 | $358,187 | $271,134 |
| 2022 | $6,184 | $616,982 | $351,164 | $265,818 |
| 2021 | $6,063 | $604,885 | $344,279 | $260,606 |
| 2020 | $6,002 | $598,683 | $340,749 | $257,934 |
| 2019 | $5,883 | $586,945 | $334,068 | $252,877 |
| 2018 | $5,768 | $575,437 | $327,518 | $247,919 |
| 2017 | $5,654 | $564,154 | $321,096 | $243,058 |
| 2016 | $5,545 | $553,093 | $314,800 | $238,293 |
| 2015 | $5,460 | $544,786 | $310,072 | $234,714 |
| 2014 | $5,354 | $534,115 | $303,998 | $230,117 |
Source: Public Records
Map
Nearby Homes
- 26516 El Mar Dr
- 26972 Venado Dr
- 26914 Jasper Unit 254
- 27854 Emerald
- 27657 Aquamarine Unit 157
- 26982 Stonehaven Unit 77
- 26848 Alexandrite
- 27756 Emerald Unit 2
- 26646 Guadiana
- 26635 Guadiana
- 27075 La Fuente
- 26998 El Retiro
- 26562 Lucinda
- 26553 Lucinda
- 26611 Loma Verde
- 26611 Dorothea
- 26732 Trasmiras
- 26848 Park Terrace Ln Unit 130
- 26896 Park Terrace Ln Unit 229
- 26742 Bridlewood Dr
- 26712 Cadiz Cir
- 26671 Venado Dr
- 26661 Venado Dr
- 26681 Venado Dr
- 26721 Magdalena Ln
- 26722 Cadiz Cir
- 26691 Venado Dr
- 26731 Magdalena Ln
- 26691 Cadiz Cir
- 26711 Cadiz Cir
- 26681 Cadiz Cir
- 26732 Cadiz Cir
- 26671 Cadiz Cir
- 26721 Cadiz Cir
- 26745 Magdalena Ln
- 26666 Venado Dr
- 26661 Cadiz Cir
- 26672 Venado Dr
- 26662 Venado Dr
- 26731 Cadiz Cir