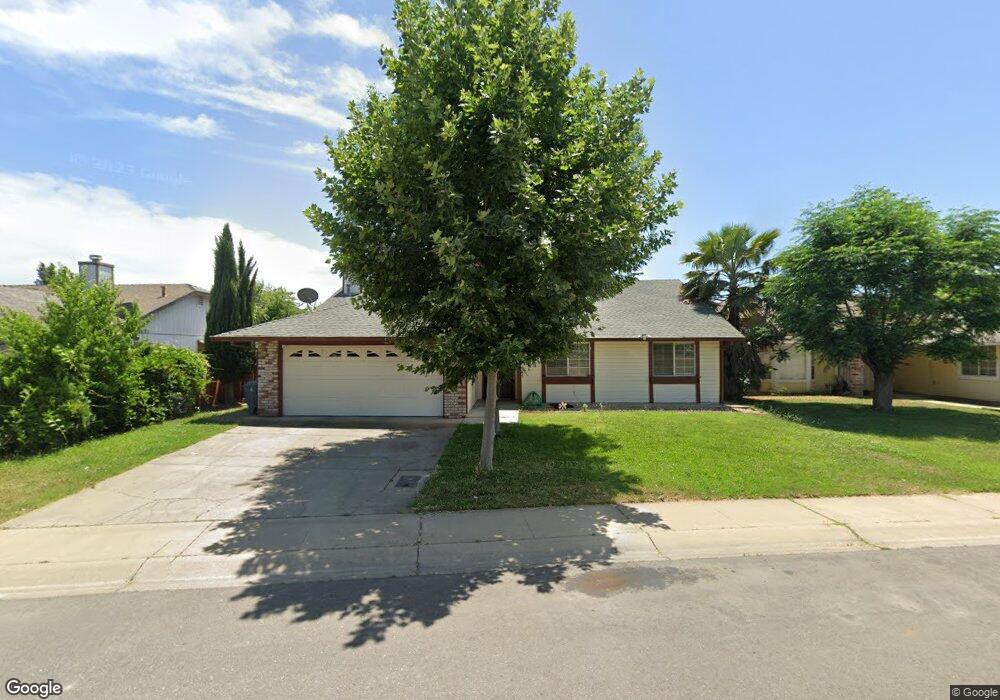
2670 Apricot St Live Oak, CA 95953
Estimated Value: $305,000 - $409,852
3
Beds
2
Baths
1,588
Sq Ft
$239/Sq Ft
Est. Value
About This Home
This home is located at 2670 Apricot St, Live Oak, CA 95953 and is currently estimated at $379,213, approximately $238 per square foot. 2670 Apricot St is a home located in Sutter County.
Ownership History
Date
Name
Owned For
Owner Type
Purchase Details
Closed on
Jun 24, 2024
Sold by
Kular Avtar and Kaur Gurpreet
Bought by
Kular Avtar and Kaur Gurpreet
Current Estimated Value
Home Financials for this Owner
Home Financials are based on the most recent Mortgage that was taken out on this home.
Original Mortgage
$200,000
Outstanding Balance
$197,408
Interest Rate
6.94%
Mortgage Type
New Conventional
Estimated Equity
$181,805
Purchase Details
Closed on
Dec 13, 2023
Sold by
Kaur Surinder
Bought by
Kaur Avtar and Kaur Gurpreet
Create a Home Valuation Report for This Property
The Home Valuation Report is an in-depth analysis detailing your home's value as well as a comparison with similar homes in the area
Home Values in the Area
Average Home Value in this Area
Purchase History
| Date | Buyer | Sale Price | Title Company |
|---|---|---|---|
| Kular Avtar | -- | Atlas Title Company | |
| Kaur Avtar | -- | None Listed On Document |
Source: Public Records
Mortgage History
| Date | Status | Borrower | Loan Amount |
|---|---|---|---|
| Open | Kular Avtar | $200,000 |
Source: Public Records
Tax History Compared to Growth
Tax History
| Year | Tax Paid | Tax Assessment Tax Assessment Total Assessment is a certain percentage of the fair market value that is determined by local assessors to be the total taxable value of land and additions on the property. | Land | Improvement |
|---|---|---|---|---|
| 2025 | $4,313 | $372,300 | $71,400 | $300,900 |
| 2024 | $4,313 | $365,000 | $70,000 | $295,000 |
| 2023 | $4,313 | $160,845 | $39,905 | $120,940 |
| 2022 | $1,913 | $157,692 | $39,123 | $118,569 |
| 2021 | $1,800 | $154,630 | $38,370 | $116,260 |
| 2020 | $1,881 | $153,044 | $37,976 | $115,068 |
| 2019 | $1,830 | $150,043 | $37,232 | $112,811 |
| 2018 | $1,806 | $147,102 | $36,502 | $110,600 |
| 2017 | $1,791 | $144,217 | $35,786 | $108,431 |
| 2016 | $1,665 | $141,389 | $35,084 | $106,305 |
| 2015 | $1,651 | $139,265 | $34,557 | $104,708 |
| 2014 | $1,627 | $136,536 | $33,880 | $102,656 |
Source: Public Records
Map
Nearby Homes