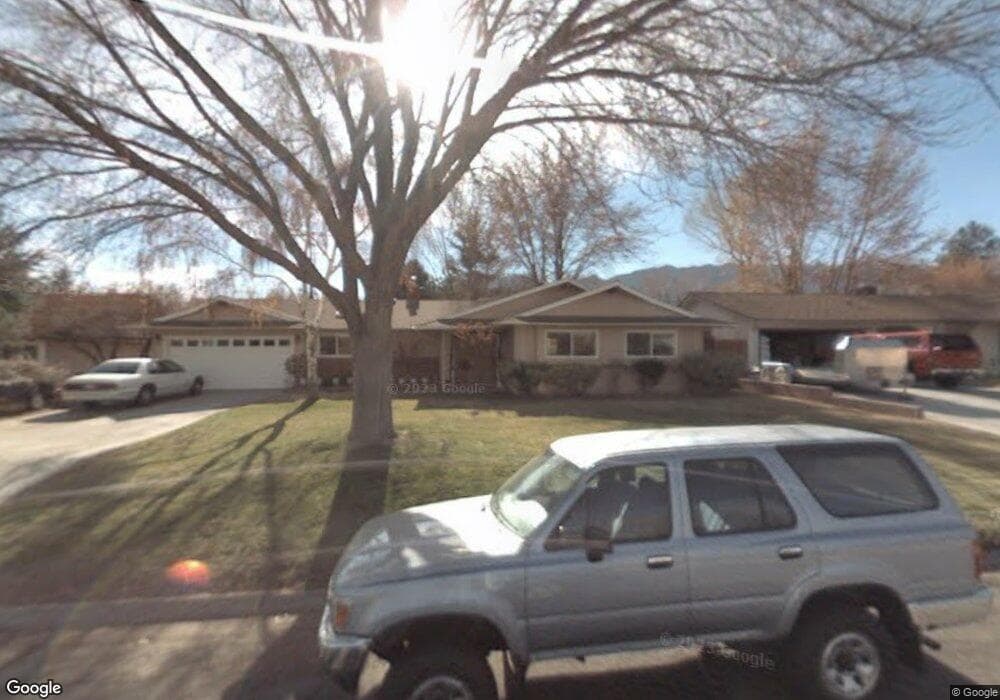
2670 Glenbrook Way Bishop, CA 93514
Estimated Value: $503,000 - $671,000
4
Beds
2
Baths
1,606
Sq Ft
$379/Sq Ft
Est. Value
About This Home
This home is located at 2670 Glenbrook Way, Bishop, CA 93514 and is currently estimated at $608,035, approximately $378 per square foot. 2670 Glenbrook Way is a home located in Inyo County with nearby schools including Bishop Elementary School, Elm Street Elementary School, and Home Street Middle School.
Create a Home Valuation Report for This Property
The Home Valuation Report is an in-depth analysis detailing your home's value as well as a comparison with similar homes in the area
Home Values in the Area
Average Home Value in this Area
Tax History Compared to Growth
Tax History
| Year | Tax Paid | Tax Assessment Tax Assessment Total Assessment is a certain percentage of the fair market value that is determined by local assessors to be the total taxable value of land and additions on the property. | Land | Improvement |
|---|---|---|---|---|
| 2025 | $4,136 | $401,651 | $188,272 | $213,379 |
| 2024 | $4,136 | $394,913 | $184,581 | $210,332 |
| 2023 | $4,044 | $386,350 | $180,962 | $205,388 |
| 2022 | $3,907 | $368,475 | $177,414 | $191,061 |
| 2021 | $3,967 | $361,251 | $173,936 | $187,315 |
| 2020 | $3,715 | $357,548 | $172,153 | $185,395 |
| 2019 | $3,715 | $350,538 | $168,778 | $181,760 |
| 2018 | $3,633 | $343,666 | $165,469 | $178,197 |
| 2017 | $3,559 | $336,928 | $162,225 | $174,703 |
| 2016 | $3,517 | $330,323 | $159,045 | $171,278 |
| 2015 | $3,449 | $325,362 | $156,656 | $168,706 |
| 2014 | $3,379 | $318,990 | $153,588 | $165,402 |
Source: Public Records
Map
Nearby Homes
- 2693 Glenbrook Way
- 807 S Barlow Ln
- 807 S Barlow Ln Unit 34
- 85 Schober Ln Unit 17
- 223 Wildrose Ln
- 3115 W Line St
- 3115 W Line St Unit 1
- 324 Mclaren Ln Unit 12
- 896 Home St
- 1369 Glenwood Ln
- 1369 Glenwood Ln Unit 48
- 543 Sierra St
- 771 N Main St Unit 39
- 1424 Rocking West Dr
- 2371 Edinburgh Ave
- 2322 Galloway Ave
- 411 E Line St
- 2310 Fiora Ave
- 1495 Argyle Ln
- 1495 Argyle Ln Unit 86
- 2664 Glenbrook Way
- 2680 Glenbrook Way
- 2681 Underwood Ln
- 2658 Glenbrook Way
- 2694 Glenbrook Way
- 2671 Underwood Ln
- 2687 Underwood Ln
- 2669 Glenbrook Way
- 2665 Underwood Ln
- 2695 Underwood Ln Unit 60
- 2695 Underwood Ln
- 2652 Glenbrook Way
- 2661 Glenbrook Way
- 2679 Glenbrook Way Unit 27
- 2679 Glenbrook Way
- 2659 Underwood Ln Unit 55
- 2659 Underwood Ln
- 2704 Glenbrook Way
- 2705 Underwood Ln
- 2657 Glenbrook Way