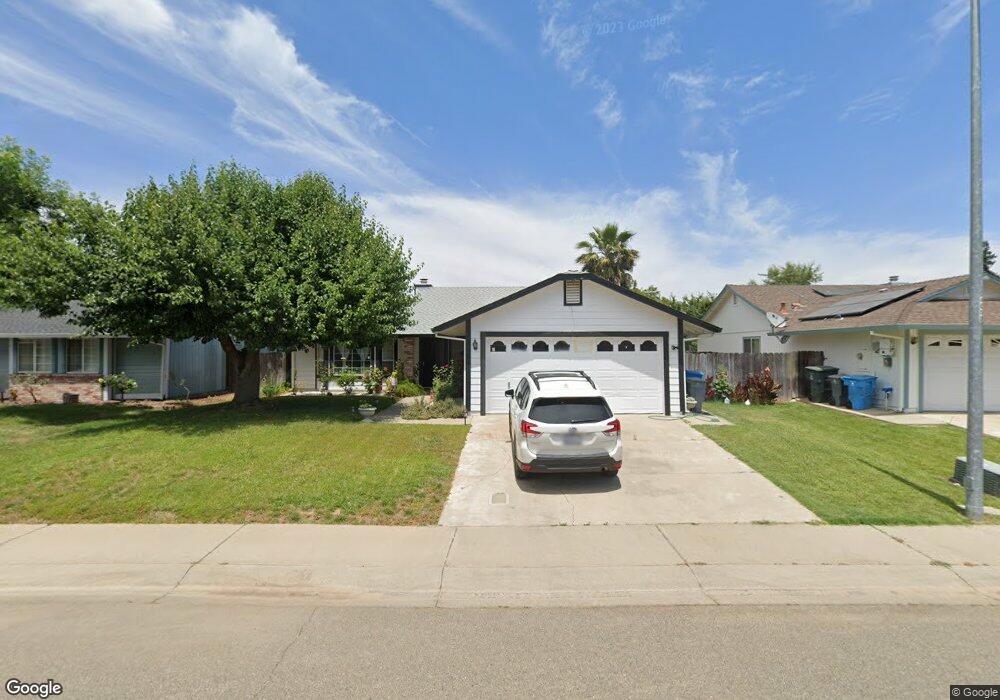
2671 Pear St Live Oak, CA 95953
Estimated Value: $188,000 - $360,000
3
Beds
2
Baths
1,207
Sq Ft
$252/Sq Ft
Est. Value
About This Home
This home is located at 2671 Pear St, Live Oak, CA 95953 and is currently estimated at $304,018, approximately $251 per square foot. 2671 Pear St is a home located in Sutter County.
Ownership History
Date
Name
Owned For
Owner Type
Purchase Details
Closed on
Jun 17, 2010
Sold by
Fernandez Fidel V
Bought by
Munoz Omaira
Current Estimated Value
Purchase Details
Closed on
Jul 24, 2002
Sold by
Arellano Jose Manuel and Arellano Cristina
Bought by
Munoz Omaira
Home Financials for this Owner
Home Financials are based on the most recent Mortgage that was taken out on this home.
Original Mortgage
$97,627
Interest Rate
6.6%
Mortgage Type
FHA
Create a Home Valuation Report for This Property
The Home Valuation Report is an in-depth analysis detailing your home's value as well as a comparison with similar homes in the area
Purchase History
| Date | Buyer | Sale Price | Title Company |
|---|---|---|---|
| Munoz Omaira | -- | None Available | |
| Munoz Omaira | $98,500 | Placer Title Company |
Source: Public Records
Mortgage History
| Date | Status | Borrower | Loan Amount |
|---|---|---|---|
| Previous Owner | Munoz Omaira | $97,627 |
Source: Public Records
Tax History
| Year | Tax Paid | Tax Assessment Tax Assessment Total Assessment is a certain percentage of the fair market value that is determined by local assessors to be the total taxable value of land and additions on the property. | Land | Improvement |
|---|---|---|---|---|
| 2025 | $1,678 | $142,637 | $36,195 | $106,442 |
| 2024 | $1,678 | $139,841 | $35,486 | $104,355 |
| 2023 | $1,678 | $137,100 | $34,791 | $102,309 |
| 2022 | $1,625 | $134,412 | $34,109 | $100,303 |
| 2021 | $1,526 | $131,798 | $33,451 | $98,347 |
| 2020 | $1,598 | $130,446 | $33,108 | $97,338 |
| 2019 | $1,554 | $127,888 | $32,459 | $95,429 |
| 2018 | $1,533 | $125,381 | $31,823 | $93,558 |
| 2017 | $1,520 | $122,923 | $31,199 | $91,724 |
| 2016 | $1,413 | $120,512 | $30,587 | $89,925 |
Source: Public Records
Map
Nearby Homes
Your Personal Tour Guide
Ask me questions while you tour the home.