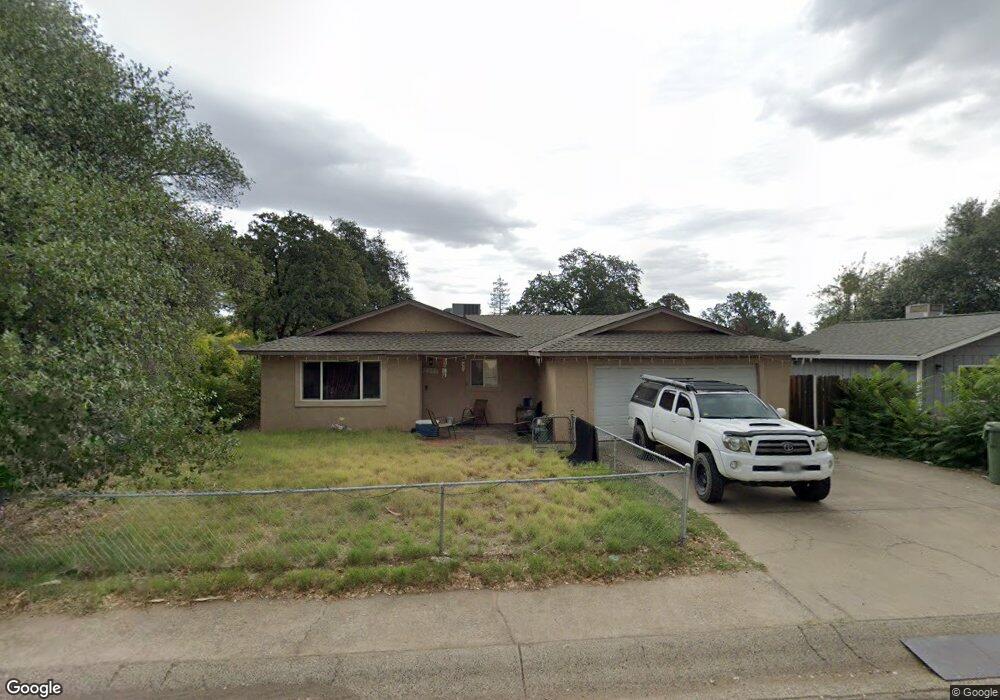
2675 Shasta View Dr Redding, CA 96002
Shasta View NeighborhoodEstimated Value: $309,000 - $340,000
3
Beds
2
Baths
1,488
Sq Ft
$218/Sq Ft
Est. Value
About This Home
This home is located at 2675 Shasta View Dr, Redding, CA 96002 and is currently estimated at $324,404, approximately $218 per square foot. 2675 Shasta View Dr is a home located in Shasta County with nearby schools including Shasta Meadows Elementary School, Parsons Junior High School, and Enterprise High School.
Ownership History
Date
Name
Owned For
Owner Type
Purchase Details
Closed on
Mar 5, 2018
Sold by
Lee Karen
Bought by
Saephan Low M and Munday Brandy M
Current Estimated Value
Home Financials for this Owner
Home Financials are based on the most recent Mortgage that was taken out on this home.
Original Mortgage
$185,576
Outstanding Balance
$158,986
Interest Rate
4.37%
Mortgage Type
FHA
Estimated Equity
$165,418
Purchase Details
Closed on
Mar 2, 2018
Sold by
Lee Karen
Bought by
Saephan Lo M and Munday Brandy M
Home Financials for this Owner
Home Financials are based on the most recent Mortgage that was taken out on this home.
Original Mortgage
$185,576
Outstanding Balance
$158,986
Interest Rate
4.37%
Mortgage Type
FHA
Estimated Equity
$165,418
Purchase Details
Closed on
Aug 31, 2007
Sold by
Chambers Brandon
Bought by
Lee Karen
Purchase Details
Closed on
Apr 15, 2003
Sold by
Payne Robert C and Payne Verna J
Bought by
Chambers Brandon
Home Financials for this Owner
Home Financials are based on the most recent Mortgage that was taken out on this home.
Original Mortgage
$156,051
Interest Rate
5.6%
Mortgage Type
FHA
Create a Home Valuation Report for This Property
The Home Valuation Report is an in-depth analysis detailing your home's value as well as a comparison with similar homes in the area
Home Values in the Area
Average Home Value in this Area
Purchase History
| Date | Buyer | Sale Price | Title Company |
|---|---|---|---|
| Saephan Low M | $189,000 | Fidelity Natl Title Co Of Ca | |
| Saephan Lo M | $189,000 | Fidelity National Title Co | |
| Lee Karen | $30,800 | None Available | |
| Chambers Brandon | $158,500 | Placer Title Company |
Source: Public Records
Mortgage History
| Date | Status | Borrower | Loan Amount |
|---|---|---|---|
| Open | Saephan Low M | $185,576 | |
| Closed | Saephan Lo M | $185,576 | |
| Previous Owner | Chambers Brandon | $156,051 |
Source: Public Records
Tax History
| Year | Tax Paid | Tax Assessment Tax Assessment Total Assessment is a certain percentage of the fair market value that is determined by local assessors to be the total taxable value of land and additions on the property. | Land | Improvement |
|---|---|---|---|---|
| 2025 | $2,348 | $215,044 | $45,510 | $169,534 |
| 2024 | $2,315 | $210,828 | $44,618 | $166,210 |
| 2023 | $2,315 | $206,695 | $43,744 | $162,951 |
| 2022 | $2,250 | $202,643 | $42,887 | $159,756 |
| 2021 | $2,173 | $198,671 | $42,047 | $156,624 |
| 2020 | $2,163 | $196,635 | $41,616 | $155,019 |
| 2019 | $2,146 | $192,780 | $40,800 | $151,980 |
| 2018 | $2,121 | $189,000 | $40,000 | $149,000 |
| 2017 | $2,327 | $200,000 | $40,000 | $160,000 |
| 2016 | $1,936 | $174,000 | $40,000 | $134,000 |
| 2015 | $1,817 | $162,000 | $40,000 | $122,000 |
| 2014 | $1,806 | $159,000 | $30,000 | $129,000 |
Source: Public Records
Map
Nearby Homes
- 2571 Erin Ln
- 2295 Chelsa Cir
- 2115 Hawn Ave
- 2385 Shining Star Way
- 2912 Squire Ave
- 3072 Alta Mesa Dr
- 0 Shasta View Unit 25-1945
- 1877 Wheeler St
- 2354 Suzette Ave
- 3361 Alta Mesa Dr
- 1701 E Cypress Ave
- 2498 Saturn Skyway
- 3512 Capricorn Way
- 2093 Victor Ave
- 3341 Timbercreek Dr
- 1556 Minor St
- 3385 Wimbledon Dr
- 3035 Argyle Rd
- 2906 Regal Ave
- 3425 Silverwood St
- 2661 Shasta View Dr
- 2674 Rainbow Ln
- 2688 Rainbow Ln
- 2660 Rainbow Ln
- 2389 Kerry Ave
- 2462 Christian Ave
- 2646 Rainbow Ln
- 2398 Christian Ave
- 2633 Shasta View Dr
- 2390 Kerry Ave
- 2632 Rainbow Ln
- 2377 Kerry Ave
- 2388 Christian Ave
- 2621 Shasta View Dr
- 2376 Kerry Ave
- 2513 Erin Ln
- 2447 Christian Ave
- 2459 Christian Ave
- 2620 Rainbow Ln
- 2512 Christian Ave
Your Personal Tour Guide
Ask me questions while you tour the home.