2677 Oak Rd Unit 104 Walnut Creek, CA 94597
Contra Costa Centre NeighborhoodEstimated Value: $595,000 - $740,000
2
Beds
2
Baths
1,144
Sq Ft
$557/Sq Ft
Est. Value
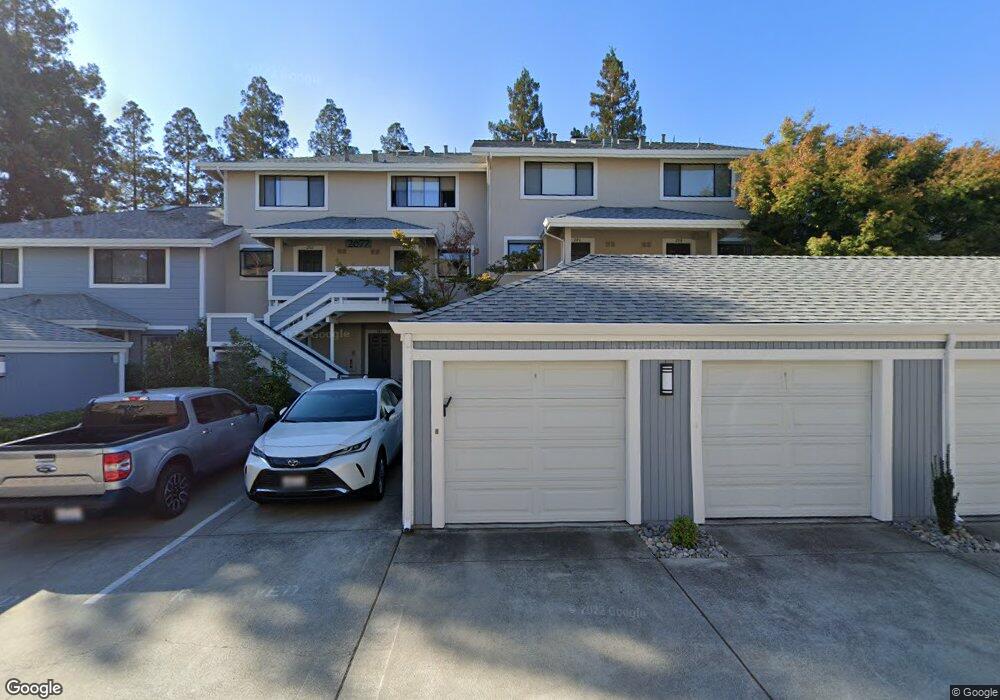
About This Home
This home is located at 2677 Oak Rd Unit 104, Walnut Creek, CA 94597 and is currently estimated at $637,223, approximately $557 per square foot. 2677 Oak Rd Unit 104 is a home located in Contra Costa County with nearby schools including Buena Vista Elementary School, Walnut Creek Intermediate School, and Las Lomas High School.
Ownership History
Date
Name
Owned For
Owner Type
Purchase Details
Closed on
Mar 5, 2007
Sold by
Scott Ruth Furiya
Bought by
Chavanne Sylvie D
Current Estimated Value
Home Financials for this Owner
Home Financials are based on the most recent Mortgage that was taken out on this home.
Original Mortgage
$43,500
Outstanding Balance
$34,928
Interest Rate
6.23%
Mortgage Type
Credit Line Revolving
Estimated Equity
$602,295
Purchase Details
Closed on
Oct 25, 2002
Sold by
Hariri Farid and Davachi Hariri Marjan
Bought by
Scott Ruth Furiya
Purchase Details
Closed on
May 3, 2000
Sold by
Saaid Magidi
Bought by
Hariri Farid and Davachi Hariri Marjan
Home Financials for this Owner
Home Financials are based on the most recent Mortgage that was taken out on this home.
Original Mortgage
$160,000
Interest Rate
7.83%
Mortgage Type
Purchase Money Mortgage
Purchase Details
Closed on
Dec 30, 1999
Sold by
Fatemeh Magidi
Bought by
Magidi Saaid
Create a Home Valuation Report for This Property
The Home Valuation Report is an in-depth analysis detailing your home's value as well as a comparison with similar homes in the area
Home Values in the Area
Average Home Value in this Area
Purchase History
| Date | Buyer | Sale Price | Title Company |
|---|---|---|---|
| Chavanne Sylvie D | $435,000 | Commonwealth Land Title | |
| Scott Ruth Furiya | $335,000 | Old Republic Title | |
| Hariri Farid | $200,000 | First American Title Guarant | |
| Magidi Saaid | -- | -- |
Source: Public Records
Mortgage History
| Date | Status | Borrower | Loan Amount |
|---|---|---|---|
| Open | Chavanne Sylvie D | $43,500 | |
| Previous Owner | Hariri Farid | $160,000 |
Source: Public Records
Tax History Compared to Growth
Tax History
| Year | Tax Paid | Tax Assessment Tax Assessment Total Assessment is a certain percentage of the fair market value that is determined by local assessors to be the total taxable value of land and additions on the property. | Land | Improvement |
|---|---|---|---|---|
| 2025 | $7,390 | $582,792 | $355,038 | $227,754 |
| 2024 | $7,216 | $571,366 | $348,077 | $223,289 |
| 2023 | $7,216 | $560,163 | $341,252 | $218,911 |
| 2022 | $7,180 | $549,180 | $334,561 | $214,619 |
| 2021 | $6,837 | $538,412 | $328,001 | $210,411 |
| 2019 | $6,682 | $522,444 | $318,273 | $204,171 |
| 2018 | $6,470 | $512,201 | $312,033 | $200,168 |
| 2017 | $6,344 | $502,159 | $305,915 | $196,244 |
| 2016 | $5,646 | $440,000 | $268,047 | $171,953 |
| 2015 | $5,575 | $438,500 | $267,133 | $171,367 |
| 2014 | $5,322 | $413,000 | $251,599 | $161,401 |
Source: Public Records
Map
Nearby Homes
- 2617 Oak Rd Unit C
- 2708 Oak Rd Unit 9
- 2709 Oak Rd Unit H
- 2704 Oak Rd Unit 80
- 2704 Oak Rd Unit 77
- 2712 Oak Rd Unit 60
- 2712 Oak Rd Unit 57
- Plan 5X at Oak Grove
- Plan 6 at Oak Grove
- Plan 3 at Oak Grove
- Plan 4X at Oak Grove
- Plan 5 at Oak Grove
- Plan 6X at Oak Grove
- 178 Oak Cir
- 186 Oak Cir
- 231 Oak Cir
- 225 Oak Cir
- 2724 Oak Rd Unit 88
- 2578 Oak Rd Unit 212
- 2735 Oak Rd
- 2677 Oak Rd Unit 202
- 2677 Oak Rd Unit 204
- 2677 Oak Rd Unit 206
- 2677 Oak Rd Unit 208
- 2677 Oak Rd Unit 210
- 2677 Oak Rd Unit 212
- 2677 Oak Rd Unit 100
- 2677 Oak Rd Unit 102
- 2677 Oak Rd Unit 108
- 2677 Oak Rd Unit 112
- 2681 Oak Rd
- 2681 Oak Rd Unit 222
- 2681 Oak Rd Unit 224
- 2681 Oak Rd Unit 116
- 2681 Oak Rd Unit 120
- 2681 Oak Rd Unit 124
- 2681 Oak Rd Unit 214
- 2681 Oak Rd Unit 216
- 2681 Oak Rd Unit 218
- 2681 Oak Rd Unit 220