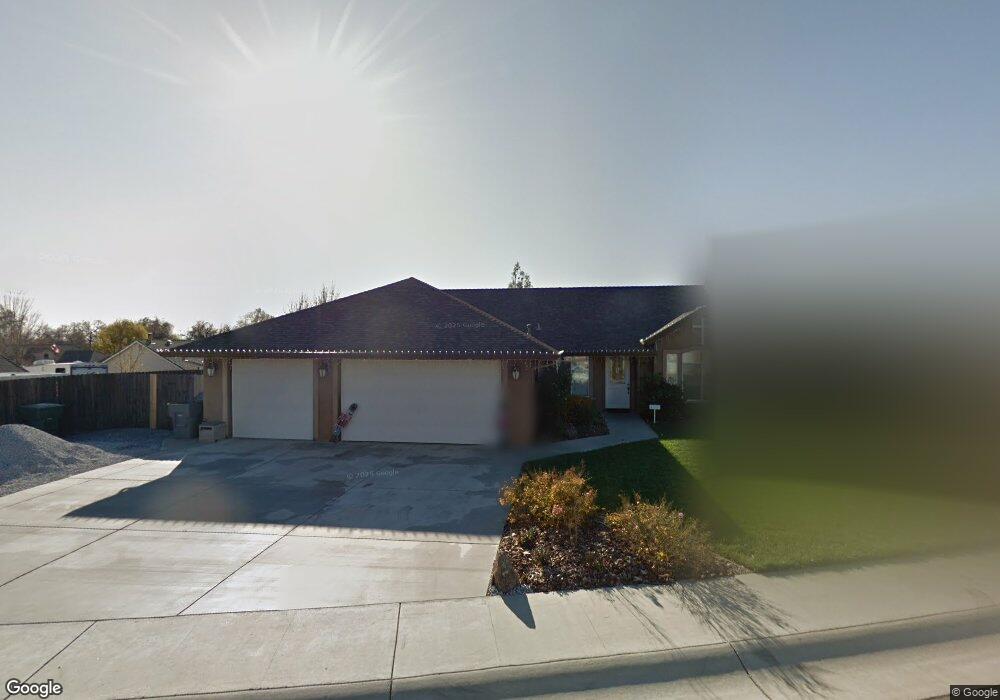
2677 Pendant Way Redding, CA 96001
Girvan NeighborhoodEstimated Value: $437,000 - $486,360
4
Beds
2
Baths
2,113
Sq Ft
$220/Sq Ft
Est. Value
About This Home
This home is located at 2677 Pendant Way, Redding, CA 96001 and is currently estimated at $465,840, approximately $220 per square foot. 2677 Pendant Way is a home located in Shasta County with nearby schools including Bonny View Elementary School, Sequoia Middle School, and Shasta High School.
Ownership History
Date
Name
Owned For
Owner Type
Purchase Details
Closed on
Mar 10, 2009
Sold by
Deutsche Bank National Trust Company
Bought by
Williams Timothy R and Williams Courtney A
Current Estimated Value
Home Financials for this Owner
Home Financials are based on the most recent Mortgage that was taken out on this home.
Original Mortgage
$267,073
Outstanding Balance
$170,182
Interest Rate
5.17%
Mortgage Type
FHA
Estimated Equity
$295,658
Purchase Details
Closed on
Dec 17, 2008
Sold by
Speake Kareem C and Speake Holly I
Bought by
Deutsche Bank National Trust Company
Purchase Details
Closed on
Mar 1, 2007
Sold by
Crb Properties Llc
Bought by
Speake Kareem C and Speake Holly L
Home Financials for this Owner
Home Financials are based on the most recent Mortgage that was taken out on this home.
Original Mortgage
$96,317
Interest Rate
6.21%
Mortgage Type
Stand Alone Second
Create a Home Valuation Report for This Property
The Home Valuation Report is an in-depth analysis detailing your home's value as well as a comparison with similar homes in the area
Home Values in the Area
Average Home Value in this Area
Purchase History
| Date | Buyer | Sale Price | Title Company |
|---|---|---|---|
| Williams Timothy R | $272,000 | Fidelity National | |
| Deutsche Bank National Trust Company | $263,500 | None Available | |
| Speake Kareem C | $481,581 | Fidelity Natl Title Co Of Ca |
Source: Public Records
Mortgage History
| Date | Status | Borrower | Loan Amount |
|---|---|---|---|
| Open | Williams Timothy R | $267,073 | |
| Previous Owner | Speake Kareem C | $96,317 | |
| Previous Owner | Speake Kareem C | $385,268 |
Source: Public Records
Tax History
| Year | Tax Paid | Tax Assessment Tax Assessment Total Assessment is a certain percentage of the fair market value that is determined by local assessors to be the total taxable value of land and additions on the property. | Land | Improvement |
|---|---|---|---|---|
| 2025 | $3,549 | $350,255 | $90,135 | $260,120 |
| 2024 | $3,494 | $343,388 | $88,368 | $255,020 |
| 2023 | $3,494 | $336,656 | $86,636 | $250,020 |
| 2022 | $3,434 | $330,056 | $84,938 | $245,118 |
| 2021 | $3,416 | $323,585 | $83,273 | $240,312 |
| 2020 | $3,461 | $320,268 | $82,420 | $237,848 |
| 2019 | $3,284 | $313,989 | $80,804 | $233,185 |
| 2018 | $3,313 | $307,833 | $79,220 | $228,613 |
| 2017 | $3,294 | $301,798 | $77,667 | $224,131 |
| 2016 | $3,187 | $295,882 | $76,145 | $219,737 |
| 2015 | $3,146 | $291,439 | $75,002 | $216,437 |
| 2014 | $3,123 | $285,731 | $73,533 | $212,198 |
Source: Public Records
Map
Nearby Homes
- 7420 Platinum Way
- 7022 Marvin Trail
- 6871 Hemlock St
- 7728 Pit Rd
- 6955 Yvonne Ct
- 3182 Island Dr
- 7035 Riverside Dr
- 6725 Reflection St
- 6958 Riverside Dr
- 0 Waverly Manor
- 6681 Riverside Dr
- 6733 El Camino Dr
- 2850 Balaton Ave
- 6551 El Camino Dr
- 6405 El Camino Dr
- 2339 North Dr
- 2048 Wilder Dr
- 8818 Valley View Rd
- 2381 S Bonnyview Rd
- 19233 W Niles Ln
- 2659 Pendant Way
- 7220 Platinum Way
- 7206 Platinum Way
- 7234 Platinum Way
- 2750 Pendant Way
- 7248 Platinum Way
- 2641 Pendant Way
- 2678 Pendant Way
- 2664 Pendant Way
- 2650 Pendant Way
- 2636 Pendant Way
- 7262 Platinum Way
- 2622 Pendant Way
- 2692 Pendant Way
- 2623 Pendant Way
- 7247 Platinum Way
- 2817 Girvan Rd
- 7276 Platinum Way
- 2831 Girvan Rd
- 2821 Girvan Rd
Your Personal Tour Guide
Ask me questions while you tour the home.