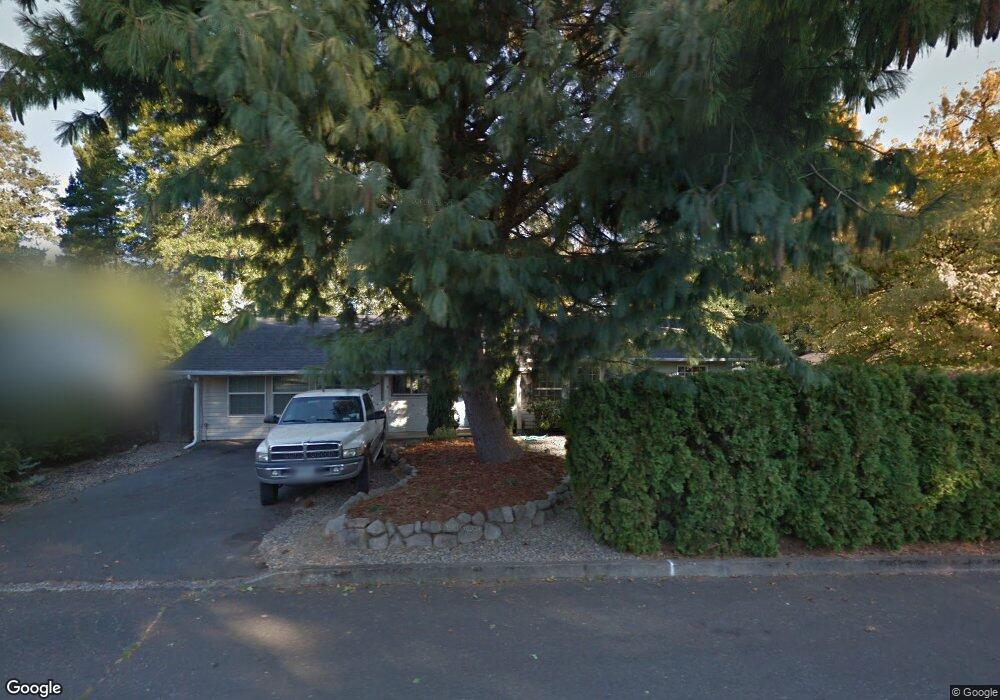
2679 Mark Ln West Linn, OR 97068
Bolton NeighborhoodEstimated Value: $547,000 - $632,000
3
Beds
2
Baths
1,705
Sq Ft
$340/Sq Ft
Est. Value
About This Home
This home is located at 2679 Mark Ln, West Linn, OR 97068 and is currently estimated at $579,655, approximately $339 per square foot. 2679 Mark Ln is a home located in Clackamas County with nearby schools including Cedaroak Park Primary School, West Linn High School, and Harmony Academy.
Ownership History
Date
Name
Owned For
Owner Type
Purchase Details
Closed on
Feb 24, 2015
Sold by
Robley Donna Claire and Donna Claire Robley Trust
Bought by
Grissom Angela E
Current Estimated Value
Purchase Details
Closed on
May 13, 2014
Sold by
Robley D C
Bought by
Robley Donna Claire and Donna Claire Robley Trust
Purchase Details
Closed on
Mar 7, 2011
Sold by
Robley Donna Claire
Bought by
Robley D C
Purchase Details
Closed on
Dec 16, 2003
Sold by
Robley D C
Bought by
Robley Donna Claire and Donna Claire Robley Trust
Purchase Details
Closed on
Dec 6, 2001
Sold by
Gimarelli Boettcher Terra
Bought by
Robley D C
Home Financials for this Owner
Home Financials are based on the most recent Mortgage that was taken out on this home.
Original Mortgage
$140,000
Interest Rate
5.37%
Create a Home Valuation Report for This Property
The Home Valuation Report is an in-depth analysis detailing your home's value as well as a comparison with similar homes in the area
Home Values in the Area
Average Home Value in this Area
Purchase History
| Date | Buyer | Sale Price | Title Company |
|---|---|---|---|
| Grissom Angela E | $289,000 | Stewart Title | |
| Robley Donna Claire | -- | None Available | |
| Robley D C | -- | None Available | |
| Robley Donna Claire | -- | -- | |
| Robley D C | $175,000 | Chicago Title Insurance Co |
Source: Public Records
Mortgage History
| Date | Status | Borrower | Loan Amount |
|---|---|---|---|
| Previous Owner | Robley D C | $140,000 |
Source: Public Records
Tax History Compared to Growth
Tax History
| Year | Tax Paid | Tax Assessment Tax Assessment Total Assessment is a certain percentage of the fair market value that is determined by local assessors to be the total taxable value of land and additions on the property. | Land | Improvement |
|---|---|---|---|---|
| 2025 | $4,051 | $241,791 | -- | -- |
| 2024 | $3,900 | $234,749 | -- | -- |
| 2023 | $3,900 | $227,912 | $0 | $0 |
| 2022 | $3,681 | $221,274 | $0 | $0 |
| 2021 | $3,494 | $214,830 | $0 | $0 |
| 2020 | $3,518 | $208,573 | $0 | $0 |
| 2019 | $3,355 | $202,499 | $0 | $0 |
| 2018 | $3,205 | $196,601 | $0 | $0 |
| 2017 | $3,081 | $190,875 | $0 | $0 |
| 2016 | $3,452 | $185,316 | $0 | $0 |
| 2015 | $2,916 | $156,445 | $0 | $0 |
| 2014 | $2,804 | $151,888 | $0 | $0 |
Source: Public Records
Map
Nearby Homes
- 2700 Underhill Ln Unit 1
- 2488 Tulane St
- 20120 Larkspur Ln Unit 85
- 20080 Larkspur Ln Unit 50
- 20070 Larkspur Ln Unit 61
- 19623 White Cloud Cir
- 2583 Pimlico Dr
- 20930 Fawn Ct Unit 26
- 19885 Willamette Dr
- 4622 Mapleton Dr
- 4050 Serango Ct
- 4610 Kenthorpe Way
- 6403 Tompkins Ct
- 6345 Caufield St
- 19155 Nixon Ave
- 3820 Kenthorpe Way
- 19788 Wildwood Dr
- 1954 Buck St
- 2343 Appaloosa Way
- 3893 Cedaroak Dr