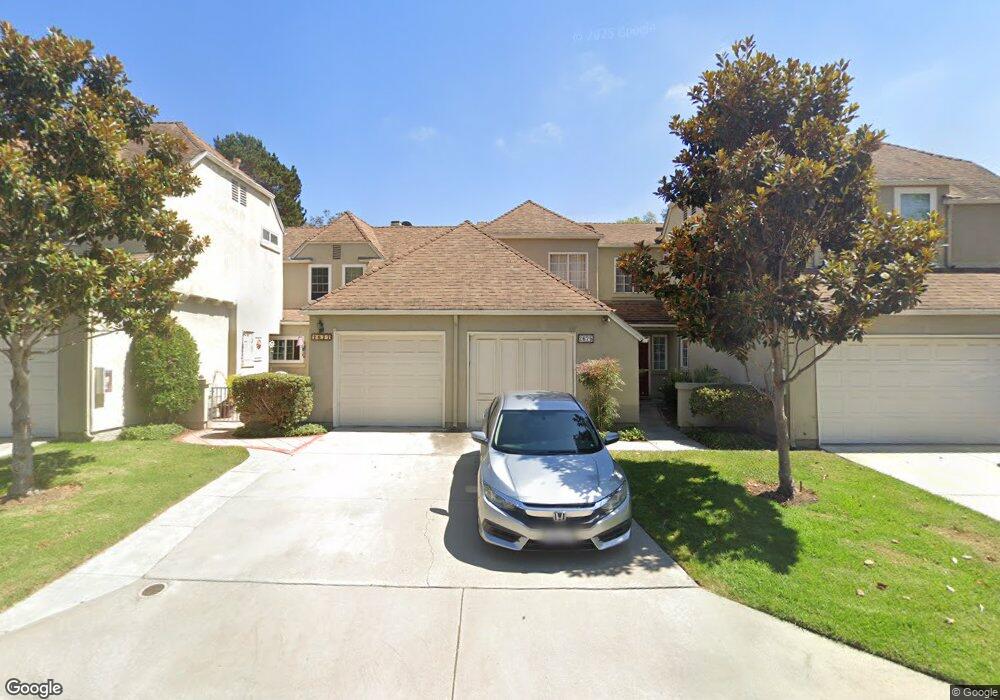
2679 Regent Rd Unit 124 Carlsbad, CA 92010
Tamarack Point NeighborhoodEstimated Value: $875,000 - $982,000
3
Beds
3
Baths
1,629
Sq Ft
$576/Sq Ft
Est. Value
About This Home
This home is located at 2679 Regent Rd Unit 124, Carlsbad, CA 92010 and is currently estimated at $938,691, approximately $576 per square foot. 2679 Regent Rd Unit 124 is a home located in San Diego County with nearby schools including Hope Elementary School, Calavera Hills Middle, and Carlsbad High School.
Ownership History
Date
Name
Owned For
Owner Type
Purchase Details
Closed on
Feb 13, 2001
Sold by
Bergmann Nancy
Bought by
Hassing Thomas C and Hassing Mary E
Current Estimated Value
Home Financials for this Owner
Home Financials are based on the most recent Mortgage that was taken out on this home.
Original Mortgage
$207,200
Outstanding Balance
$75,012
Interest Rate
7.11%
Mortgage Type
Purchase Money Mortgage
Estimated Equity
$863,679
Purchase Details
Closed on
Nov 11, 1997
Sold by
King Robert L and King Kirsten T
Bought by
Bergmann Nancy
Home Financials for this Owner
Home Financials are based on the most recent Mortgage that was taken out on this home.
Original Mortgage
$80,000
Interest Rate
7.31%
Mortgage Type
Purchase Money Mortgage
Purchase Details
Closed on
May 1, 1987
Create a Home Valuation Report for This Property
The Home Valuation Report is an in-depth analysis detailing your home's value as well as a comparison with similar homes in the area
Home Values in the Area
Average Home Value in this Area
Purchase History
| Date | Buyer | Sale Price | Title Company |
|---|---|---|---|
| Hassing Thomas C | $259,000 | First American Title | |
| Bergmann Nancy | $160,000 | -- | |
| -- | $121,000 | -- |
Source: Public Records
Mortgage History
| Date | Status | Borrower | Loan Amount |
|---|---|---|---|
| Open | Hassing Thomas C | $207,200 | |
| Previous Owner | Bergmann Nancy | $80,000 | |
| Closed | Hassing Thomas C | $25,900 |
Source: Public Records
Tax History
| Year | Tax Paid | Tax Assessment Tax Assessment Total Assessment is a certain percentage of the fair market value that is determined by local assessors to be the total taxable value of land and additions on the property. | Land | Improvement |
|---|---|---|---|---|
| 2025 | $4,030 | $390,251 | $115,624 | $274,627 |
| 2024 | $4,030 | $382,600 | $113,357 | $269,243 |
| 2023 | $4,008 | $375,099 | $111,135 | $263,964 |
| 2022 | $3,944 | $367,745 | $108,956 | $258,789 |
| 2021 | $3,913 | $360,535 | $106,820 | $253,715 |
| 2020 | $3,886 | $356,839 | $105,725 | $251,114 |
| 2019 | $3,815 | $349,843 | $103,652 | $246,191 |
| 2018 | $3,652 | $342,984 | $101,620 | $241,364 |
| 2017 | $91 | $336,260 | $99,628 | $236,632 |
| 2016 | $3,444 | $329,668 | $97,675 | $231,993 |
| 2015 | $3,430 | $324,717 | $96,208 | $228,509 |
| 2014 | $3,371 | $318,357 | $94,324 | $224,033 |
Source: Public Records
Map
Nearby Homes
- 4822 Nelson Ct
- 4843 Nelson Ct
- 4809 Kelly Dr
- 4669 Coralwood Cir
- 4600 Catmint Ln
- 2500 Thyme Way
- 2536 Elderberry Ln
- 2586 Delphinium Ln
- 2579 Elderberry Ln
- 2572 Elderberry Ln
- 4942 Spirea Way
- 4806 Parsley Ln
- 4640 Coralwood Cir
- 2522 Thyme Way
- 2523 Delphinium Ln
- 2531 Delphinium Ln
- 2541 Delphinium Ln
- 2559 Delphinium Ln
- 4967 Cindy Ave
- 4375 Stanford St
- 2669 Regent Rd Unit 115
- 2691 Regent Rd
- 2697 Regent Rd
- 2695 Regent Rd
- 2693 Regent Rd
- 2689 Regent Rd
- 2687 Regent Rd Unit 134
- 2685 Regent Rd
- 2683 Regent Rd
- 2681 Regent Rd
- 2667 Regent Rd
- 2665 Regent Rd
- 2663 Regent Rd
- 2661 Regent Rd
- 2659 Regent Rd
- 2657 Regent Rd
- 2655 Regent Rd
- 2653 Regent Rd Unit 103
- 2651 Regent Rd
- 2699 Regent Rd Unit 144
Your Personal Tour Guide
Ask me questions while you tour the home.