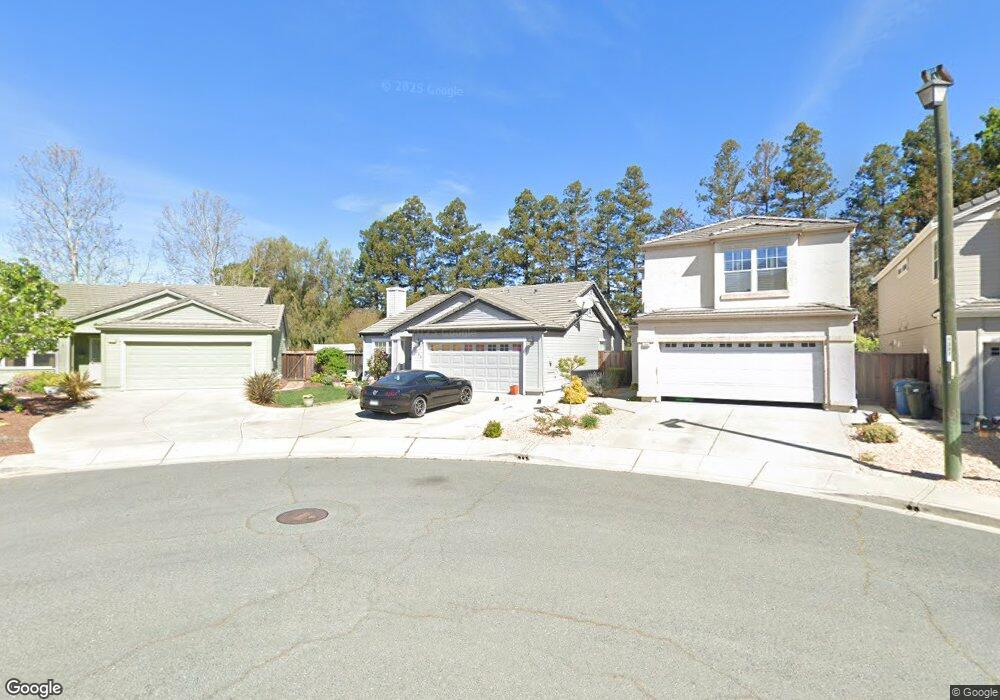
268 Stranahan Cir Clayton, CA 94517
Estimated Value: $749,000 - $801,834
3
Beds
2
Baths
1,361
Sq Ft
$570/Sq Ft
Est. Value
About This Home
This home is located at 268 Stranahan Cir, Clayton, CA 94517 and is currently estimated at $775,709, approximately $569 per square foot. 268 Stranahan Cir is a home located in Contra Costa County with nearby schools including Mt. Diablo Elementary School, Diablo View Middle School, and College Park High School.
Ownership History
Date
Name
Owned For
Owner Type
Purchase Details
Closed on
Jun 17, 2015
Sold by
Groebner John and Groebner Kathy
Bought by
Laventure Gaylynn
Current Estimated Value
Home Financials for this Owner
Home Financials are based on the most recent Mortgage that was taken out on this home.
Original Mortgage
$164,877
Outstanding Balance
$127,975
Interest Rate
3.81%
Mortgage Type
FHA
Estimated Equity
$647,734
Purchase Details
Closed on
Jun 27, 2011
Sold by
City Of Clayton Redevelopment Agency
Bought by
Groebner John and Groebner Kathy
Home Financials for this Owner
Home Financials are based on the most recent Mortgage that was taken out on this home.
Original Mortgage
$160,817
Interest Rate
4.55%
Mortgage Type
FHA
Purchase Details
Closed on
Mar 14, 2011
Sold by
Ruff Ryan Jeffery and Ruff Jennifer Kathleen
Bought by
City Of Clayton Redevelopment Agency
Purchase Details
Closed on
Nov 14, 2006
Sold by
The Clayton Redevelopment Agency
Bought by
Ruff Ryan Jeffery and Ruff Jennifer Kathleen
Home Financials for this Owner
Home Financials are based on the most recent Mortgage that was taken out on this home.
Original Mortgage
$280,400
Interest Rate
6.28%
Mortgage Type
Purchase Money Mortgage
Purchase Details
Closed on
Oct 16, 2006
Sold by
Lim Lik Seng and Cheung Fung Mui
Bought by
The Clayton Redevelopment Agency
Home Financials for this Owner
Home Financials are based on the most recent Mortgage that was taken out on this home.
Original Mortgage
$280,400
Interest Rate
6.28%
Mortgage Type
Purchase Money Mortgage
Purchase Details
Closed on
Mar 21, 2005
Sold by
Lim Lik Seng and Cheung Fung Mui
Bought by
Lim Lik Seng and Cheung Fung Mui
Home Financials for this Owner
Home Financials are based on the most recent Mortgage that was taken out on this home.
Original Mortgage
$100,000
Interest Rate
5.53%
Mortgage Type
Credit Line Revolving
Purchase Details
Closed on
Oct 23, 1997
Sold by
Lim Lik Seng
Bought by
Lim Lik Seng and Cheung Fung Mui
Purchase Details
Closed on
Jul 12, 1996
Sold by
Lemke John F
Bought by
Lim Lik Seng
Home Financials for this Owner
Home Financials are based on the most recent Mortgage that was taken out on this home.
Original Mortgage
$146,300
Interest Rate
8.03%
Mortgage Type
Purchase Money Mortgage
Purchase Details
Closed on
Jul 9, 1996
Sold by
Cheung Fung Mui
Bought by
Lim Lik Seng
Home Financials for this Owner
Home Financials are based on the most recent Mortgage that was taken out on this home.
Original Mortgage
$146,300
Interest Rate
8.03%
Mortgage Type
Purchase Money Mortgage
Create a Home Valuation Report for This Property
The Home Valuation Report is an in-depth analysis detailing your home's value as well as a comparison with similar homes in the area
Home Values in the Area
Average Home Value in this Area
Purchase History
| Date | Buyer | Sale Price | Title Company |
|---|---|---|---|
| Laventure Gaylynn | $168,000 | Placer Title Company | |
| Groebner John | $165,000 | Placer Title Company | |
| City Of Clayton Redevelopment Agency | $378,000 | Placer Title Company | |
| Ruff Ryan Jeffery | $350,500 | Alliance Title Company | |
| The Clayton Redevelopment Agency | $517,000 | Alliance Title Company | |
| Lim Lik Seng | -- | -- | |
| Lim Lik Seng | -- | -- | |
| Lim Lik Seng | -- | Financial Title Company | |
| Lim Lik Seng | -- | Financial Title Company |
Source: Public Records
Mortgage History
| Date | Status | Borrower | Loan Amount |
|---|---|---|---|
| Open | Laventure Gaylynn | $164,877 | |
| Previous Owner | Groebner John | $160,817 | |
| Previous Owner | Ruff Ryan Jeffery | $280,400 | |
| Previous Owner | Lim Lik Seng | $100,000 | |
| Previous Owner | Lim Lik Seng | $146,300 |
Source: Public Records
Tax History Compared to Growth
Tax History
| Year | Tax Paid | Tax Assessment Tax Assessment Total Assessment is a certain percentage of the fair market value that is determined by local assessors to be the total taxable value of land and additions on the property. | Land | Improvement |
|---|---|---|---|---|
| 2025 | $3,469 | $201,782 | $120,181 | $81,601 |
| 2024 | $3,382 | $197,826 | $117,825 | $80,001 |
| 2023 | $3,382 | $193,948 | $115,515 | $78,433 |
| 2022 | $3,311 | $190,146 | $113,250 | $76,896 |
| 2021 | $3,213 | $186,419 | $111,030 | $75,389 |
| 2019 | $3,133 | $180,891 | $107,738 | $73,153 |
| 2018 | $3,007 | $177,345 | $105,626 | $71,719 |
| 2017 | $2,895 | $173,868 | $103,555 | $70,313 |
| 2016 | $2,790 | $170,460 | $101,525 | $68,935 |
| 2015 | $2,739 | $175,890 | $106,600 | $69,290 |
| 2014 | $2,663 | $172,445 | $104,512 | $67,933 |
Source: Public Records
Map
Nearby Homes
- 980 Oak St
- 1183 Shell Ln
- 1280 Shell Cir
- 1224 Easley Dr
- 1338 Shell Ln
- 5900 High St
- 1343 Shell Ln
- 1295 Shell Cir Unit 1
- 1398 Shell Ln
- 1039 Feather Cir
- 4 Mt Wilson Way
- 23 Mt Wilson Way
- 1221 Buckeye Terrace
- 814 Chert Place
- 5872 Herriman Dr
- 1105 Peacock Creek Dr
- 1731 Indian Wells Way
- 9 Herriman Ct
- 415 Chupcan Place Unit 3
- 11 Donner Creek Ct
- 266 Stranahan Cir
- 270 Stranahan Cir
- 264 Stranahan Cir
- 272 Stranahan Cir
- 272 Stranahan CI
- 274 Stranahan Cir
- 262 Stranahan Cir
- 276 Stranahan Cir
- 260 Stranahan Cir
- 263 Stranahan Cir
- 278 Stranahan Cir
- 261 Stranahan Cir
- 258 Stranahan Cir
- 280 Stranahan Cir
- 257 Stranahan Cir
- 256 Stranahan CI
- 256 Stranahan Cir
- 282 Stranahan Cir
- 251 Stranahan Cir
- 254 Stranahan Cir