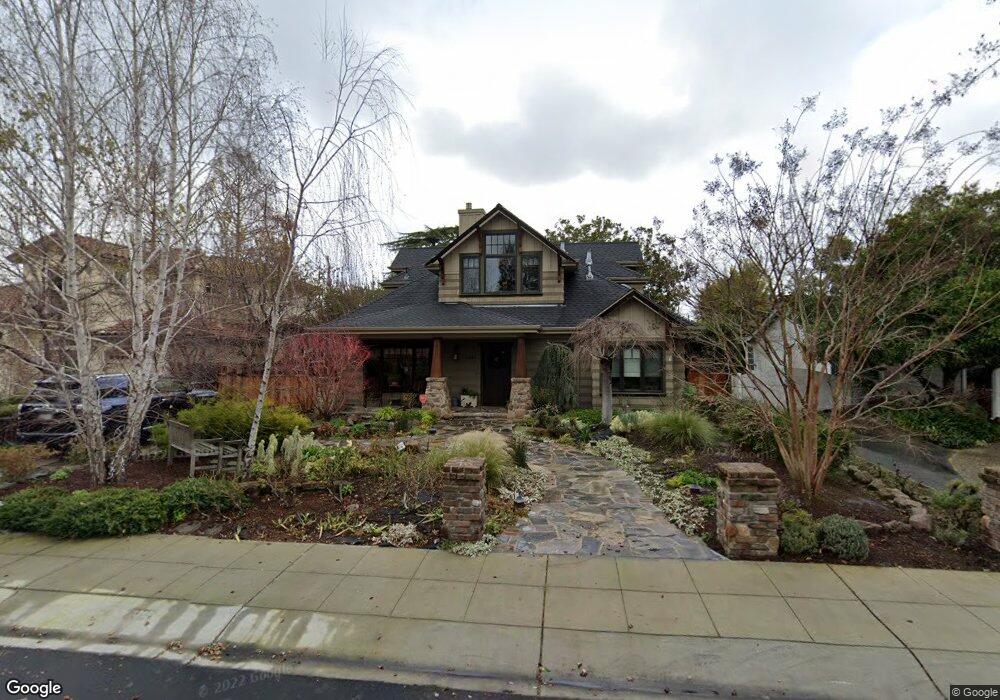
2681 Ramona St Palo Alto, CA 94306
Midtown Palo Alto NeighborhoodEstimated Value: $4,186,000 - $5,238,000
3
Beds
3
Baths
1,544
Sq Ft
$3,085/Sq Ft
Est. Value
About This Home
This home is located at 2681 Ramona St, Palo Alto, CA 94306 and is currently estimated at $4,762,847, approximately $3,084 per square foot. 2681 Ramona St is a home located in Santa Clara County with nearby schools including El Carmelo Elementary School, Jane Lathrop Stanford Middle School, and Palo Alto High School.
Ownership History
Date
Name
Owned For
Owner Type
Purchase Details
Closed on
Oct 5, 2024
Sold by
Mclaren Leslie Cameron
Bought by
Mclaren Family Revocable Trust and Mclaren
Current Estimated Value
Purchase Details
Closed on
May 29, 2021
Sold by
Mclaren Lestie Cameron and The Mclaren Family Revocable T
Bought by
Mclaren Lestie Cameron
Home Financials for this Owner
Home Financials are based on the most recent Mortgage that was taken out on this home.
Original Mortgage
$628,954
Interest Rate
2.96%
Mortgage Type
New Conventional
Purchase Details
Closed on
Oct 3, 2000
Sold by
Mclaren Leslie C
Bought by
Mclaren Leslie Cameron
Purchase Details
Closed on
Jun 10, 1998
Sold by
Moody Ollie O
Bought by
Mclaren Leslie Cameron
Home Financials for this Owner
Home Financials are based on the most recent Mortgage that was taken out on this home.
Original Mortgage
$450,000
Interest Rate
7.11%
Create a Home Valuation Report for This Property
The Home Valuation Report is an in-depth analysis detailing your home's value as well as a comparison with similar homes in the area
Home Values in the Area
Average Home Value in this Area
Purchase History
| Date | Buyer | Sale Price | Title Company |
|---|---|---|---|
| Mclaren Family Revocable Trust | -- | None Listed On Document | |
| Mclaren Lestie Cameron | -- | Amrock Llc | |
| Mclaren Leslie Cameron | -- | Amrock Llc | |
| Mclaren Leslie Cameron | -- | -- | |
| Mclaren Leslie Cameron | $600,000 | North American Title Co |
Source: Public Records
Mortgage History
| Date | Status | Borrower | Loan Amount |
|---|---|---|---|
| Previous Owner | Mclaren Leslie Cameron | $628,954 | |
| Previous Owner | Mclaren Leslie Cameron | $450,000 |
Source: Public Records
Tax History Compared to Growth
Tax History
| Year | Tax Paid | Tax Assessment Tax Assessment Total Assessment is a certain percentage of the fair market value that is determined by local assessors to be the total taxable value of land and additions on the property. | Land | Improvement |
|---|---|---|---|---|
| 2025 | $15,562 | $1,347,400 | $830,308 | $517,092 |
| 2024 | $15,562 | $1,320,981 | $814,028 | $506,953 |
| 2023 | $15,334 | $1,295,080 | $798,067 | $497,013 |
| 2022 | $15,157 | $1,269,687 | $782,419 | $487,268 |
| 2021 | $14,857 | $1,244,792 | $767,078 | $477,714 |
| 2020 | $14,541 | $1,232,029 | $759,213 | $472,816 |
| 2019 | $14,383 | $1,207,873 | $744,327 | $463,546 |
| 2018 | $13,990 | $1,184,190 | $729,733 | $454,457 |
| 2017 | $13,745 | $1,160,972 | $715,425 | $445,547 |
| 2016 | $13,375 | $1,138,209 | $701,398 | $436,811 |
| 2015 | $14,005 | $1,121,113 | $690,863 | $430,250 |
| 2014 | $13,673 | $1,099,152 | $677,330 | $421,822 |
Source: Public Records
Map
Nearby Homes
- 151 Colorado Ave
- 2685 Cowper St
- 200 Sheridan Ave Unit 303
- 200 Sheridan Ave Unit 304
- 200 Sheridan Ave Unit 103
- 200 Sheridan Ave Unit 307
- 3 Plan at Acacia
- 2A Plan at Acacia
- 1 Plan at Acacia
- 5 Plan at Acacia
- 4X Plan at Acacia
- 2 Plan at Acacia
- 4 Plan at Acacia
- 2760 Byron St
- 360 Fernando Ave
- 410 Sheridan Ave Unit 446
- 410 Sheridan Ave Unit 227
- 2590 Webster St
- 455 Grant Ave Unit 8
- 3213 Alma St