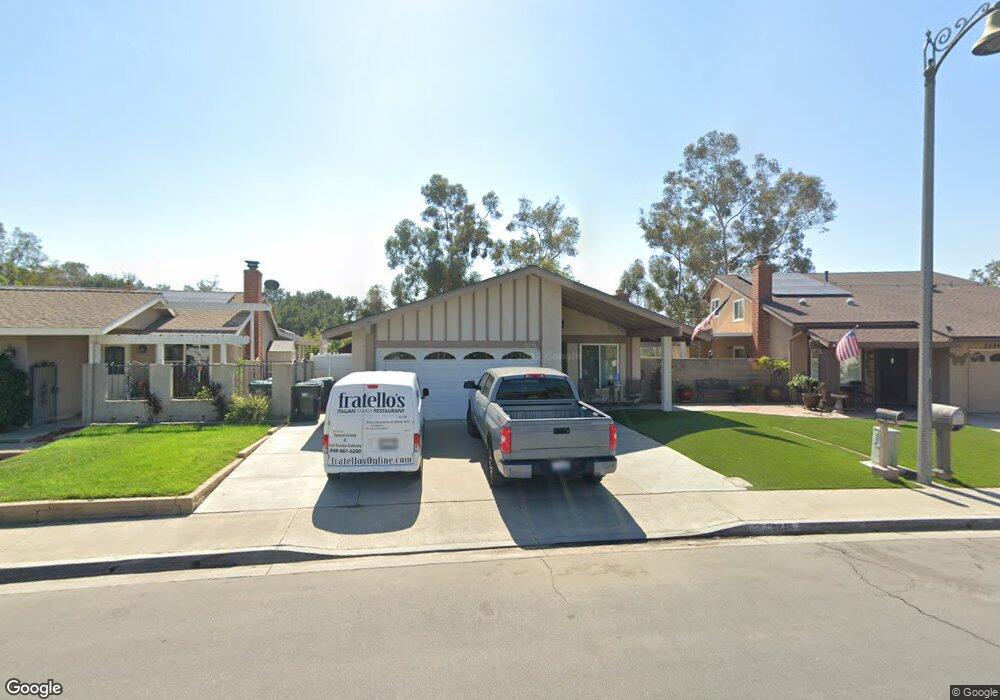
26846 Via San Jose Mission Viejo, CA 92691
Estimated Value: $975,030 - $1,379,000
3
Beds
2
Baths
1,178
Sq Ft
$996/Sq Ft
Est. Value
About This Home
This home is located at 26846 Via San Jose, Mission Viejo, CA 92691 and is currently estimated at $1,173,258, approximately $995 per square foot. 26846 Via San Jose is a home located in Orange County with nearby schools including Castille Elementary School, Newhart Middle School, and Capistrano Valley High School.
Ownership History
Date
Name
Owned For
Owner Type
Purchase Details
Closed on
Sep 5, 2025
Sold by
Madison Robert Harold
Bought by
2025 Robert H Madison Jr Trust and Madison
Current Estimated Value
Purchase Details
Closed on
Dec 13, 2005
Sold by
Nichols John and Nichols Rose Mary
Bought by
Madison Robert Harold
Home Financials for this Owner
Home Financials are based on the most recent Mortgage that was taken out on this home.
Original Mortgage
$232,000
Interest Rate
6.31%
Mortgage Type
New Conventional
Purchase Details
Closed on
Apr 29, 2005
Sold by
Nichols John and Nichols Rose Mary
Bought by
Nichols John and Nichols Rose Mary
Purchase Details
Closed on
Oct 7, 1998
Sold by
Joann Mcelroy
Bought by
Mcelroy Joann
Home Financials for this Owner
Home Financials are based on the most recent Mortgage that was taken out on this home.
Original Mortgage
$205,800
Interest Rate
6.5%
Create a Home Valuation Report for This Property
The Home Valuation Report is an in-depth analysis detailing your home's value as well as a comparison with similar homes in the area
Home Values in the Area
Average Home Value in this Area
Purchase History
| Date | Buyer | Sale Price | Title Company |
|---|---|---|---|
| 2025 Robert H Madison Jr Trust | -- | None Listed On Document | |
| Madison Robert Harold | -- | First American Title Company | |
| Nichols John | -- | -- | |
| Mcelroy Joann | -- | Stewart Title |
Source: Public Records
Mortgage History
| Date | Status | Borrower | Loan Amount |
|---|---|---|---|
| Previous Owner | Madison Robert Harold | $232,000 | |
| Previous Owner | Mcelroy Joann | $205,800 |
Source: Public Records
Tax History Compared to Growth
Tax History
| Year | Tax Paid | Tax Assessment Tax Assessment Total Assessment is a certain percentage of the fair market value that is determined by local assessors to be the total taxable value of land and additions on the property. | Land | Improvement |
|---|---|---|---|---|
| 2025 | $3,611 | $369,168 | $272,601 | $96,567 |
| 2024 | $3,611 | $361,930 | $267,256 | $94,674 |
| 2023 | $3,533 | $354,834 | $262,016 | $92,818 |
| 2022 | $3,465 | $347,877 | $256,878 | $90,999 |
| 2021 | $3,396 | $341,056 | $251,841 | $89,215 |
| 2020 | $3,362 | $337,559 | $249,258 | $88,301 |
| 2019 | $3,295 | $330,941 | $244,371 | $86,570 |
| 2018 | $3,230 | $324,452 | $239,579 | $84,873 |
| 2017 | $3,165 | $318,091 | $234,882 | $83,209 |
| 2016 | $3,104 | $311,854 | $230,276 | $81,578 |
| 2015 | $3,072 | $307,170 | $226,817 | $80,353 |
| 2014 | $3,012 | $301,153 | $222,374 | $78,779 |
Source: Public Records
Map
Nearby Homes
- 22735 Via Santa Rosa
- 26812 Via Llano
- 22831 Modesto Dr
- 26451 Via Juanita
- 22642 Via Santiago
- 22982 Cecelia
- 22792 Orellana
- 23336 Via Bahia
- 23372 Via Bahia
- 23266 Via Ronda
- 22922 Vía Nuez
- 23251 Via Guadix
- 26331 Via Lara
- 23441 Via Ronda
- 26702 Via Linares
- 23431 Via Guadix
- 26328 Via Roble Unit 28
- 26258 Via Roble Unit 36
- 22642 La Quinta Dr
- 23201 Via Mirlo
- 26852 Via San Jose
- 26842 Via San Jose
- 26862 Via San Jose
- 26832 Via San Jose
- 26845 Via San Jose
- 26872 Via San Jose
- 26822 Via San Jose
- 26831 Via San Jose
- 26871 Via San Jose
- 26882 Via San Jose
- 26812 Via San Jose
- 26851 Via San Jose
- 26821 Via San Jose
- 26892 Via San Jose
- 26865 Via San Jose
- 26802 Via San Jose
- 26791 Via San Jose
- 22871 Via Santa Rosa
- 26855 Via San Jose
- 26771 Via San Jose