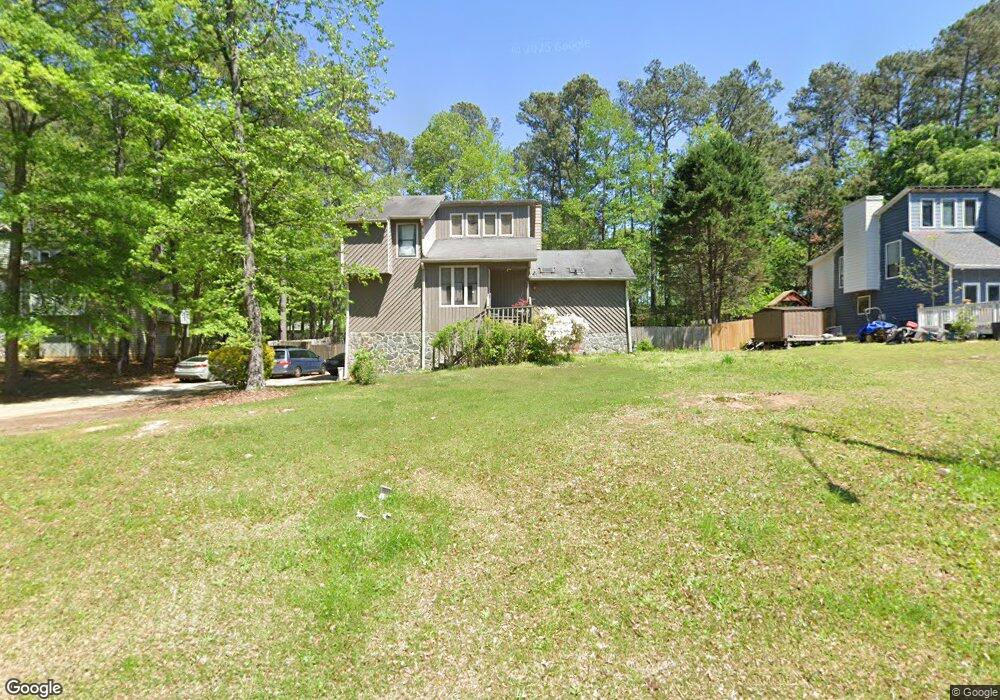
2685 Deerfield Cir SW Marietta, GA 30064
Estimated Value: $359,000 - $397,641
4
Beds
3
Baths
2,409
Sq Ft
$158/Sq Ft
Est. Value
About This Home
This home is located at 2685 Deerfield Cir SW, Marietta, GA 30064 and is currently estimated at $381,660, approximately $158 per square foot. 2685 Deerfield Cir SW is a home located in Cobb County with nearby schools including Hollydale Elementary School, Smitha Middle School, and Osborne High School.
Ownership History
Date
Name
Owned For
Owner Type
Purchase Details
Closed on
Dec 8, 2011
Sold by
711 Gregory Llc
Bought by
Handal Dina and Handal Milada
Current Estimated Value
Purchase Details
Closed on
Nov 1, 2011
Sold by
Conde Robert
Bought by
711 Gregory Llc
Purchase Details
Closed on
Oct 23, 2001
Sold by
Osborne Alan A
Bought by
Massey Laquincy
Home Financials for this Owner
Home Financials are based on the most recent Mortgage that was taken out on this home.
Original Mortgage
$139,650
Interest Rate
10.8%
Mortgage Type
New Conventional
Purchase Details
Closed on
Nov 29, 1994
Sold by
Lakeru Akintola G Michell
Bought by
Osborne Alan A and Howell Linda J
Home Financials for this Owner
Home Financials are based on the most recent Mortgage that was taken out on this home.
Original Mortgage
$75,900
Interest Rate
8.82%
Mortgage Type
FHA
Purchase Details
Closed on
Mar 1, 1993
Sold by
Skinner Harold R
Bought by
Lakern Akintola G
Create a Home Valuation Report for This Property
The Home Valuation Report is an in-depth analysis detailing your home's value as well as a comparison with similar homes in the area
Home Values in the Area
Average Home Value in this Area
Purchase History
| Date | Buyer | Sale Price | Title Company |
|---|---|---|---|
| Handal Dina | $45,500 | -- | |
| 711 Gregory Llc | $30,500 | -- | |
| Massey Laquincy | $147,000 | -- | |
| Osborne Alan A | $76,000 | -- | |
| Lakern Akintola G | $89,900 | -- |
Source: Public Records
Mortgage History
| Date | Status | Borrower | Loan Amount |
|---|---|---|---|
| Previous Owner | Massey Laquincy | $139,650 | |
| Previous Owner | Osborne Alan A | $75,900 | |
| Closed | Lakern Akintola G | -- |
Source: Public Records
Tax History Compared to Growth
Tax History
| Year | Tax Paid | Tax Assessment Tax Assessment Total Assessment is a certain percentage of the fair market value that is determined by local assessors to be the total taxable value of land and additions on the property. | Land | Improvement |
|---|---|---|---|---|
| 2025 | $4,537 | $150,592 | $22,800 | $127,792 |
| 2024 | $4,540 | $150,592 | $22,800 | $127,792 |
| 2023 | $4,540 | $150,592 | $22,800 | $127,792 |
| 2022 | $2,899 | $95,512 | $22,800 | $72,712 |
| 2021 | $2,458 | $80,972 | $14,000 | $66,972 |
| 2020 | $2,245 | $73,972 | $14,000 | $59,972 |
| 2019 | $2,245 | $73,972 | $14,000 | $59,972 |
| 2018 | $1,813 | $59,748 | $8,000 | $51,748 |
| 2017 | $1,718 | $59,748 | $8,000 | $51,748 |
| 2016 | $1,397 | $48,604 | $8,000 | $40,604 |
| 2015 | $1,432 | $48,604 | $8,000 | $40,604 |
| 2014 | $878 | $29,564 | $0 | $0 |
Source: Public Records
Map
Nearby Homes
- 2625 Deerfield Cir SW
- 2608 Foxwood Place SW Unit IV
- 2554 Red Barn Rd SW
- 2599 Candler Way SW
- 2415 Bankstone Dr SW
- 2450 Horseshoe Bend Rd SW
- 2284 Tree Arbor Way
- 2720 Cold Springs Trail SW
- 2166 Derbyshire Dr SW
- 2448 Wood Meadows Dr SW
- 2730 Hembree Rd SW
- 2885 Mondavi Place
- 2368 Beringer Ln
- Bramblewood Plan at Oak Valley Estates
- Abney Plan at Oak Valley Estates
- Sherwood Plan at Oak Valley Estates
- Hedgerow Plan at Oak Valley Estates
- Presley Plan at Oak Valley Estates
- Chatfield Plan at Oak Valley Estates
- Dunning Plan at Oak Valley Estates
- 2691 Deerfield Cir SW Unit 5
- 2681 Deerfield Cir SW
- 2508 Smith Ave SW
- 2504 Smith Ave SW Unit 5
- 2684 Deerfield Cir SW Unit V
- 2512 Smith Ave SW
- 0 Deerfield Cir Unit 8496691
- 0 Deerfield Cir Unit 7126019
- 0 Deerfield Cir Unit 3232363
- 0 Deerfield Cir Unit 7147339
- 0 Deerfield Cir
- 2677 Deerfield Cir SW Unit 4
- 2678 Deerfield Cir SW
- 2516 Smith Ave SW
- 2690 Deerfield Cir SW
- 2500 Smith Ave SW
- 2673 Deerfield Cir SW
- 2269 Smith Ave SW
- 2694 Deerfield Cir SW
- 2672 Deerfield Cir SW