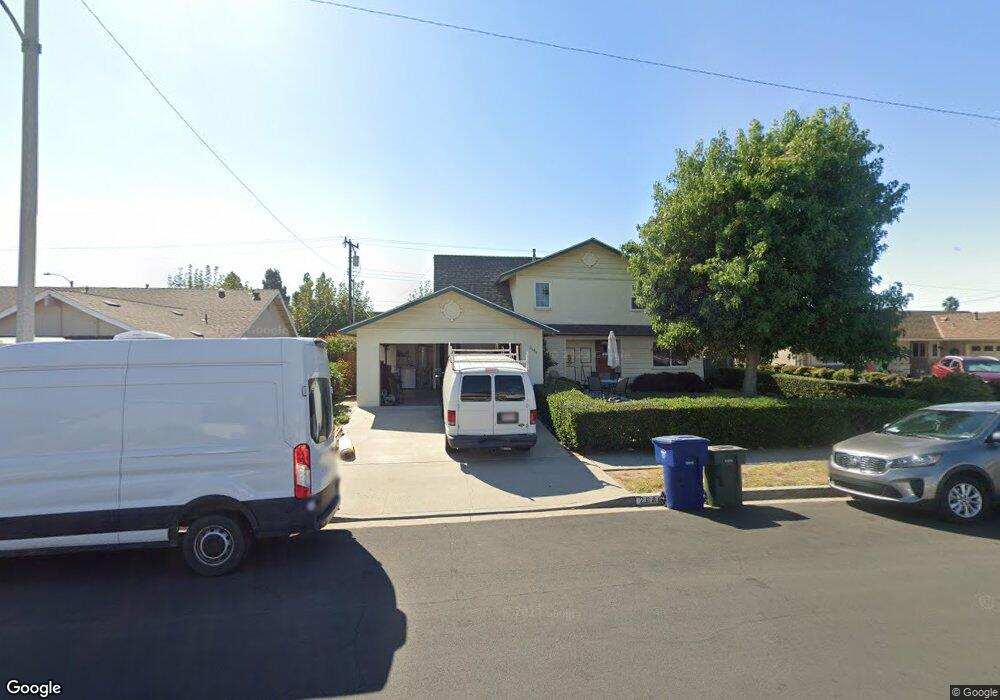
2686 Munson St Camarillo, CA 93010
Estimated Value: $869,118 - $953,000
4
Beds
3
Baths
1,792
Sq Ft
$509/Sq Ft
Est. Value
About This Home
This home is located at 2686 Munson St, Camarillo, CA 93010 and is currently estimated at $912,530, approximately $509 per square foot. 2686 Munson St is a home located in Ventura County with nearby schools including Dos Caminos Elementary School, Monte Vista Middle School, and Adolfo Camarillo High School.
Ownership History
Date
Name
Owned For
Owner Type
Purchase Details
Closed on
Sep 1, 2016
Sold by
Cawelti Andrew Edman and Cawelti Katherine N
Bought by
Cawelti Andrew E and Cawelti Katherine N
Current Estimated Value
Purchase Details
Closed on
May 13, 2004
Sold by
Cawelti Andrew Edmand and Cawelti Katherine N
Bought by
Cawelti Andrew Edman and Cawelti Katherine N
Home Financials for this Owner
Home Financials are based on the most recent Mortgage that was taken out on this home.
Original Mortgage
$125,000
Outstanding Balance
$61,029
Interest Rate
6.09%
Mortgage Type
Credit Line Revolving
Estimated Equity
$851,501
Purchase Details
Closed on
Nov 17, 1993
Sold by
Cawelti Andrew Edman and Cawelti Katherine Nadene
Bought by
Cawelti Andrew Edmand and Cawelti Katherine N
Home Financials for this Owner
Home Financials are based on the most recent Mortgage that was taken out on this home.
Original Mortgage
$150,000
Interest Rate
6.42%
Create a Home Valuation Report for This Property
The Home Valuation Report is an in-depth analysis detailing your home's value as well as a comparison with similar homes in the area
Home Values in the Area
Average Home Value in this Area
Purchase History
| Date | Buyer | Sale Price | Title Company |
|---|---|---|---|
| Cawelti Andrew E | -- | None Available | |
| Cawelti Andrew Edman | -- | -- | |
| Cawelti Andrew Edmand | -- | Continental Lawyers Title |
Source: Public Records
Mortgage History
| Date | Status | Borrower | Loan Amount |
|---|---|---|---|
| Open | Cawelti Andrew Edman | $125,000 | |
| Closed | Cawelti Andrew Edmand | $150,000 |
Source: Public Records
Tax History
| Year | Tax Paid | Tax Assessment Tax Assessment Total Assessment is a certain percentage of the fair market value that is determined by local assessors to be the total taxable value of land and additions on the property. | Land | Improvement |
|---|---|---|---|---|
| 2025 | $2,717 | $248,793 | $58,151 | $190,642 |
| 2024 | $2,717 | $243,915 | $57,011 | $186,904 |
| 2023 | $2,619 | $239,133 | $55,893 | $183,240 |
| 2022 | $2,609 | $234,445 | $54,797 | $179,648 |
| 2021 | $2,515 | $229,849 | $53,723 | $176,126 |
| 2020 | $2,505 | $227,494 | $53,173 | $174,321 |
| 2019 | $2,492 | $223,034 | $52,131 | $170,903 |
| 2018 | $2,445 | $218,661 | $51,109 | $167,552 |
| 2017 | $2,302 | $214,374 | $50,107 | $164,267 |
| 2016 | $2,246 | $210,172 | $49,125 | $161,047 |
| 2015 | $2,221 | $207,017 | $48,388 | $158,629 |
| 2014 | $2,169 | $202,964 | $47,441 | $155,523 |
Source: Public Records
Map
Nearby Homes
- 1820 Temple Ave
- 2436 Kimberly Ave
- 1440 Lexington Ct
- 2615 Shalimar St
- 2086 El Rancho Dr
- 2274 Via Tomas
- 1143 Bordeaux Ave
- 2103 Euclid Ave
- 1067 Bordeaux Ave
- 2496 Parkway Dr
- 2174 Wilcox St
- 1769 Fenmore Ave
- 1709 Las Posas Rd
- 3623 Corona St
- 647 Arneill Rd
- 3409 Reseda Ct
- 567 Mesa Dr
- 2533 Antonio Dr Unit 301
- 3429 Rio Hato Ct
- 1944 Hayden St
- 2698 Munson St
- 2674 Munson St
- 2662 Munson St
- 2687 Munson St
- 2675 Munson St
- 1711 Temple Ave
- 2658 Munson St
- 2710 Munson St
- 1713 N Landen St
- 2713 Los Nogales Ave
- 1743 Temple Ave
- 1745 N Landen St
- 2730 Munson St
- 2599 Kimberly Ave
- 1598 Sierra Madre Dr
- 1758 N Landen St
- 2739 Los Nogales Ave
- 1767 Temple Ave
- 2731 Munson St
- 2712 Wendell St
Your Personal Tour Guide
Ask me questions while you tour the home.