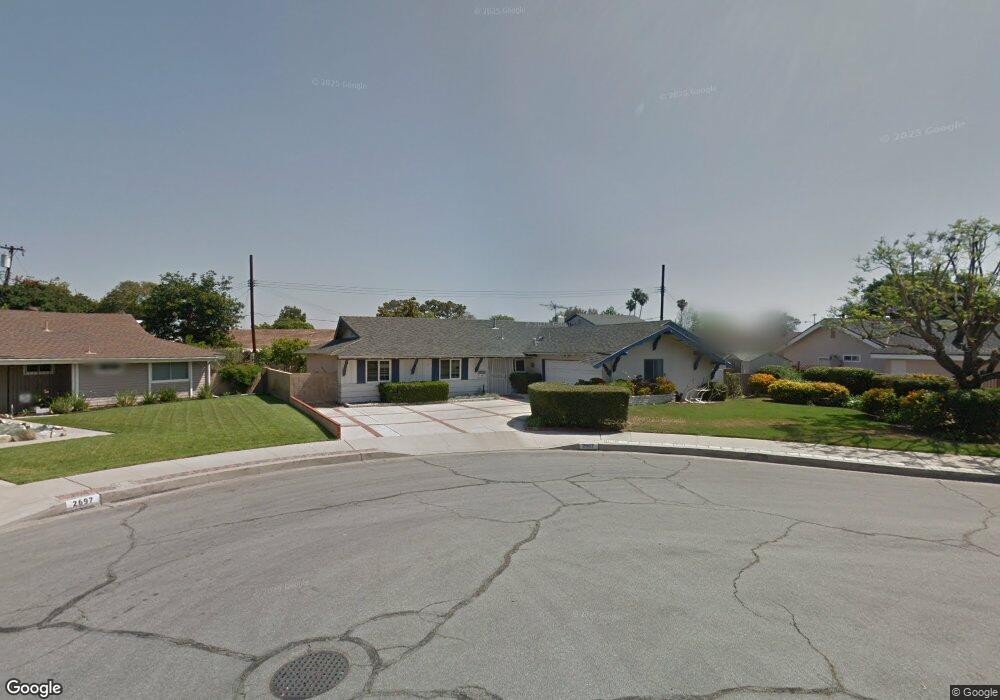
2687 N Sylvan Cir Orange, CA 92865
Estimated Value: $1,085,000 - $1,276,000
5
Beds
3
Baths
2,009
Sq Ft
$580/Sq Ft
Est. Value
About This Home
This home is located at 2687 N Sylvan Cir, Orange, CA 92865 and is currently estimated at $1,164,907, approximately $579 per square foot. 2687 N Sylvan Cir is a home located in Orange County with nearby schools including Fletcher Mandarin Language & Gate Academy, Cerro Villa Middle School, and Villa Park High School.
Ownership History
Date
Name
Owned For
Owner Type
Purchase Details
Closed on
Dec 2, 2022
Sold by
Hsu Gary Cha-Hyu and Hsu Chung-Jye
Bought by
Gary C & Chung-Jye Hsu Family Trust
Current Estimated Value
Purchase Details
Closed on
Aug 19, 1997
Sold by
Hsu Gary C and Hsu Jye Chong
Bought by
Hsu Gary Cha Hyu and Hsu Chung Jye
Home Financials for this Owner
Home Financials are based on the most recent Mortgage that was taken out on this home.
Original Mortgage
$50,000
Interest Rate
7.45%
Purchase Details
Closed on
Feb 8, 1995
Sold by
Delucia Nina
Bought by
Hsu Gary C and Hsu Chung Jye
Home Financials for this Owner
Home Financials are based on the most recent Mortgage that was taken out on this home.
Original Mortgage
$172,750
Interest Rate
8.6%
Create a Home Valuation Report for This Property
The Home Valuation Report is an in-depth analysis detailing your home's value as well as a comparison with similar homes in the area
Home Values in the Area
Average Home Value in this Area
Purchase History
We collect this data history from publicly available records. To have your information removed, we recommend requesting removal directly through your county’s website.
| Date | Buyer | Sale Price | Title Company |
|---|---|---|---|
| Gary C & Chung-Jye Hsu Family Trust | -- | -- | |
| Hsu Gary Cha Hyu | -- | Chicago Title | |
| Hsu Gary C | $192,000 | Landwood Title Company |
Source: Public Records
Mortgage History
We collect this data history from publicly available records. To have your information removed, we recommend requesting removal directly through your county’s website.
| Date | Status | Borrower | Loan Amount |
|---|---|---|---|
| Previous Owner | Hsu Gary Cha Hyu | $50,000 | |
| Previous Owner | Hsu Gary C | $172,750 |
Source: Public Records
Tax History
| Year | Tax Paid | Tax Assessment Tax Assessment Total Assessment is a certain percentage of the fair market value that is determined by local assessors to be the total taxable value of land and additions on the property. | Land | Improvement |
|---|---|---|---|---|
| 2025 | $4,190 | $373,504 | $216,694 | $156,810 |
| 2024 | $4,190 | $366,181 | $212,445 | $153,736 |
| 2023 | $4,094 | $359,001 | $208,279 | $150,722 |
| 2022 | $4,012 | $351,962 | $204,195 | $147,767 |
| 2021 | $3,901 | $345,061 | $200,191 | $144,870 |
| 2020 | $3,864 | $341,523 | $198,138 | $143,385 |
| 2019 | $3,816 | $334,827 | $194,253 | $140,574 |
| 2018 | $3,757 | $328,262 | $190,444 | $137,818 |
| 2017 | $3,604 | $321,826 | $186,710 | $135,116 |
| 2016 | $3,534 | $315,516 | $183,049 | $132,467 |
| 2015 | $3,481 | $310,777 | $180,299 | $130,478 |
| 2014 | $3,406 | $304,690 | $176,767 | $127,923 |
Source: Public Records
Map
Nearby Homes
- 542 W Dunton Ave Unit 29
- 506 W Linden Dr
- 3028 Juneberry St
- 2850 N Glassell St
- 318 W Pebble Creek Ln
- 250 W Sparkleberry Ave
- 636 S Lakeshore Dr
- 2902 E Winfield Ave
- 101 W Riverdale Ave Unit 9
- 802 S Cinda St
- 2620 N Dunbar St
- 2860 E Hempstead Rd
- 320 N Park Vista St Unit 76
- 320 N Park Vista St Unit 81
- 320 N Park Vista St Unit 18
- 320 N Park Vista St Unit 64
- 320 N Park Vista St Unit 161
- 320 N Park Vista St Unit 180
- 320 N Park Vista St Unit 109
- 320 N Park Vista St Unit 179
- 2681 N Sylvan Cir
- 2697 N Sylvan Cir
- 2698 N Dell St
- 2684 N Dell St
- 2698 N Sylvan Cir
- 2680 N Sylvan Cir
- 536 W Dunton Ave Unit 31
- 544 W Dunton Ave
- 2686 N Sylvan Cir
- 524 W Dunton Ave
- 524 W Dunton Ave Unit 36
- 534 W Dunton Ave Unit 32
- 534 W Dunton Ave
- 606 W Dunton Ave
- 542 W Dunton Ave
- 538 W Dunton Ave Unit 34
- 546 #27 Dunton
- 546 W Dunton Ave Unit 27
- 526 W Dunton Ave Unit 35
- 526 W Dunton Ave
Your Personal Tour Guide
Ask me questions while you tour the home.