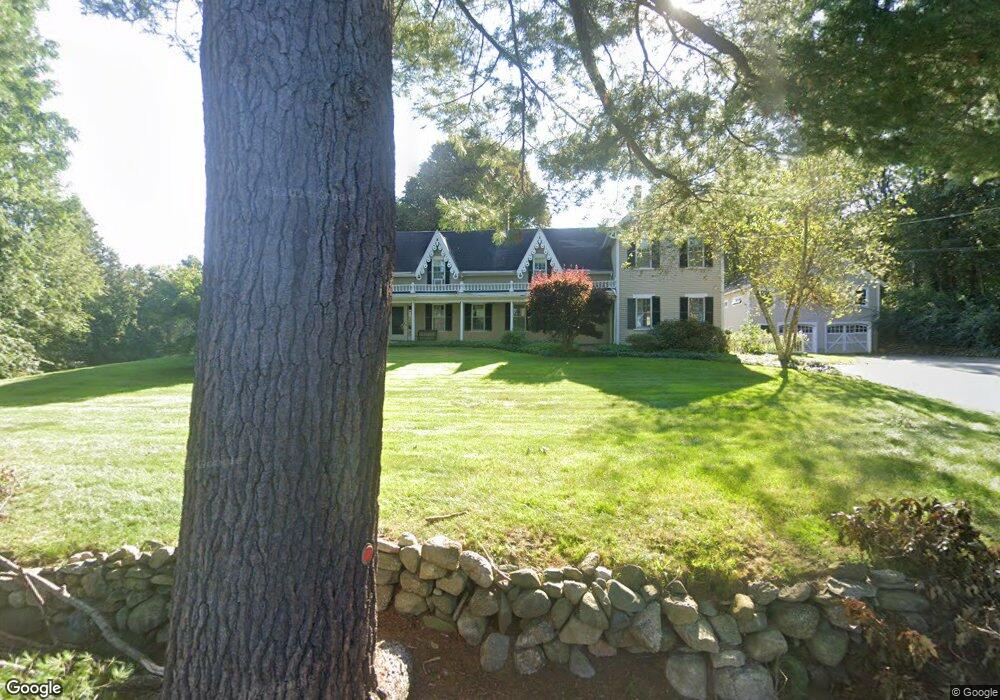
269 Highland Rd Andover, MA 01810
East Andover NeighborhoodEstimated Value: $1,106,000 - $1,331,000
5
Beds
3
Baths
3,386
Sq Ft
$361/Sq Ft
Est. Value
About This Home
This home is located at 269 Highland Rd, Andover, MA 01810 and is currently estimated at $1,223,256, approximately $361 per square foot. 269 Highland Rd is a home located in Essex County with nearby schools including Bancroft Elementary School, Doherty Middle School, and Andover High School.
Ownership History
Date
Name
Owned For
Owner Type
Purchase Details
Closed on
Jun 9, 2009
Sold by
Watt William B and Watt Helen C
Bought by
Watt Rt 1 and Watt William B
Current Estimated Value
Home Financials for this Owner
Home Financials are based on the most recent Mortgage that was taken out on this home.
Original Mortgage
$265,000
Outstanding Balance
$166,531
Interest Rate
4.83%
Mortgage Type
Purchase Money Mortgage
Estimated Equity
$1,056,725
Create a Home Valuation Report for This Property
The Home Valuation Report is an in-depth analysis detailing your home's value as well as a comparison with similar homes in the area
Home Values in the Area
Average Home Value in this Area
Purchase History
| Date | Buyer | Sale Price | Title Company |
|---|---|---|---|
| Watt Rt 1 | -- | -- | |
| Watt William B | -- | -- |
Source: Public Records
Mortgage History
| Date | Status | Borrower | Loan Amount |
|---|---|---|---|
| Open | Watt William B | $265,000 | |
| Closed | Watt Rt 1 | $265,000 |
Source: Public Records
Tax History
| Year | Tax Paid | Tax Assessment Tax Assessment Total Assessment is a certain percentage of the fair market value that is determined by local assessors to be the total taxable value of land and additions on the property. | Land | Improvement |
|---|---|---|---|---|
| 2024 | $12,494 | $970,000 | $462,200 | $507,800 |
| 2023 | $11,963 | $875,800 | $416,700 | $459,100 |
| 2022 | $11,426 | $782,600 | $363,000 | $419,600 |
| 2021 | $10,957 | $716,600 | $330,500 | $386,100 |
| 2020 | $10,518 | $700,700 | $322,600 | $378,100 |
| 2019 | $10,411 | $681,800 | $313,200 | $368,600 |
| 2018 | $10,019 | $640,600 | $301,500 | $339,100 |
| 2017 | $9,591 | $631,800 | $295,600 | $336,200 |
| 2016 | $9,365 | $631,900 | $295,600 | $336,300 |
| 2015 | $9,006 | $601,600 | $284,200 | $317,400 |
Source: Public Records
Map
Nearby Homes
- 1 Stratford Rd
- 81 Chestnut St Unit 81
- 46 Whittier St
- 33 Chestnut St Unit 2
- 52 Salem St
- 100.5 Main St Unit Q
- 96 N Main St Unit 3
- 154 Main St
- 49 Salem St
- 62 Carmel Rd
- 57 Salem St
- 124 Quail Run Rd
- 136 Quail Run Rd
- 36 Kieran Rd
- 36 High St
- 170 Haverhill St Unit 138
- 181 High St Unit 1
- 1 Sweeney Ct
- 1 Longwood Dr Unit 5 (109)
- 3 Longwood Dr Unit 107
- 271 Highland Rd
- 265 Highland Rd
- 272 Highland Rd
- 1 Rogers Brook E
- 5 Kathleen Dr
- 268 Highland Rd
- 195 Summer St
- 7 Kathleen Dr
- 251 Highland Rd
- 2 Kathleen Dr
- 3 Rogers Brook E
- 276 Highland Rd
- 266 Highland Rd
- 9 Kathleen Dr
- 198 Summer St
- 6 Kathleen Dr
- 191 Summer St
- 4 Rogers Brook E
- 8 Kathleen Dr
- 249 Highland Rd
Your Personal Tour Guide
Ask me questions while you tour the home.