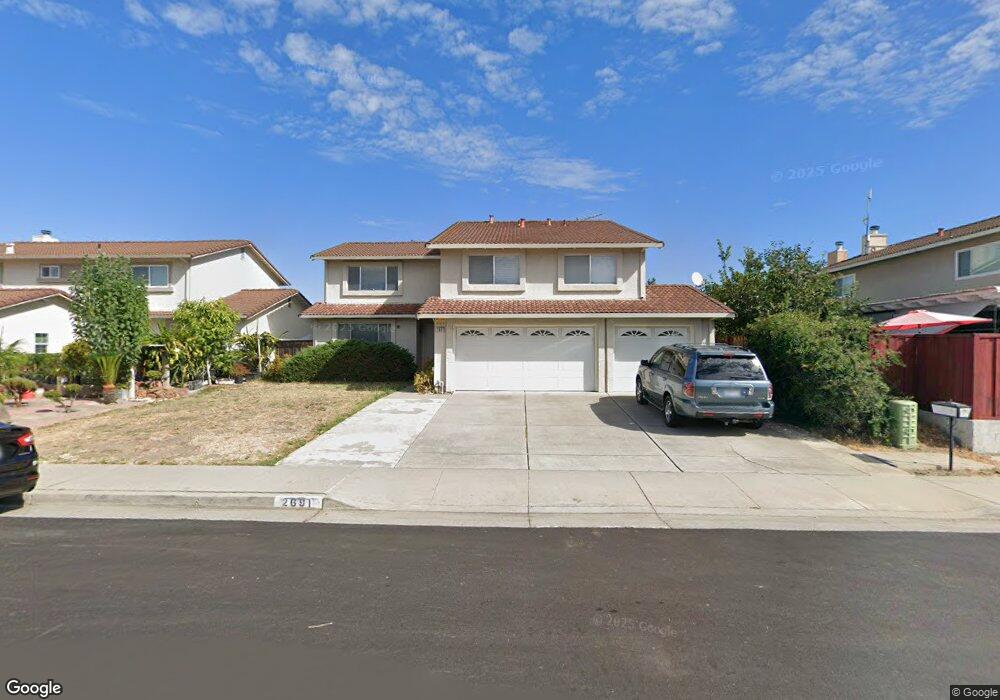
2691 Glen Fenton Way San Jose, CA 95148
Hidden Glen NeighborhoodEstimated Value: $1,613,000 - $2,182,000
4
Beds
3
Baths
2,946
Sq Ft
$637/Sq Ft
Est. Value
About This Home
This home is located at 2691 Glen Fenton Way, San Jose, CA 95148 and is currently estimated at $1,876,563, approximately $636 per square foot. 2691 Glen Fenton Way is a home located in Santa Clara County with nearby schools including Cedar Grove Elementary School, George V. Leyva Intermediate School, and William C. Overfelt High School.
Ownership History
Date
Name
Owned For
Owner Type
Purchase Details
Closed on
Aug 22, 2002
Sold by
Lee Yong Won and Lee Hee Sun
Bought by
Liang Randy and Liang Diana Quach
Current Estimated Value
Home Financials for this Owner
Home Financials are based on the most recent Mortgage that was taken out on this home.
Original Mortgage
$470,000
Outstanding Balance
$171,298
Interest Rate
4.62%
Mortgage Type
Purchase Money Mortgage
Estimated Equity
$1,705,265
Purchase Details
Closed on
Jul 21, 1999
Sold by
Lee Kyoung Y
Bought by
Lee Yong Won and Lee Hee Sun
Home Financials for this Owner
Home Financials are based on the most recent Mortgage that was taken out on this home.
Original Mortgage
$50,000
Interest Rate
7.64%
Mortgage Type
Credit Line Revolving
Create a Home Valuation Report for This Property
The Home Valuation Report is an in-depth analysis detailing your home's value as well as a comparison with similar homes in the area
Home Values in the Area
Average Home Value in this Area
Purchase History
| Date | Buyer | Sale Price | Title Company |
|---|---|---|---|
| Liang Randy | $640,000 | Stewart Title | |
| Lee Yong Won | -- | Fidelity National Title Co |
Source: Public Records
Mortgage History
| Date | Status | Borrower | Loan Amount |
|---|---|---|---|
| Open | Liang Randy | $470,000 | |
| Previous Owner | Lee Yong Won | $50,000 |
Source: Public Records
Tax History Compared to Growth
Tax History
| Year | Tax Paid | Tax Assessment Tax Assessment Total Assessment is a certain percentage of the fair market value that is determined by local assessors to be the total taxable value of land and additions on the property. | Land | Improvement |
|---|---|---|---|---|
| 2025 | $13,113 | $926,915 | $370,763 | $556,152 |
| 2024 | $13,113 | $908,742 | $363,494 | $545,248 |
| 2023 | $12,865 | $890,924 | $356,367 | $534,557 |
| 2022 | $12,809 | $873,456 | $349,380 | $524,076 |
| 2021 | $12,596 | $856,330 | $342,530 | $513,800 |
| 2020 | $12,055 | $847,550 | $339,018 | $508,532 |
| 2019 | $11,756 | $830,932 | $332,371 | $498,561 |
| 2018 | $11,650 | $814,640 | $325,854 | $488,786 |
| 2017 | $11,464 | $798,667 | $319,465 | $479,202 |
| 2016 | $10,931 | $783,007 | $313,201 | $469,806 |
| 2015 | $10,788 | $771,247 | $308,497 | $462,750 |
| 2014 | $10,032 | $756,140 | $302,454 | $453,686 |
Source: Public Records
Map
Nearby Homes
- 2708 Glen Ferguson Cir
- 2666 Hesselbein Way
- 2895 Burdick Way
- 2759 Whispering Hills Dr Unit 2759
- 2154 Pastoral Loop
- 2574 Whispering Hills Cir Unit 2574
- 2715 Sugarplum Dr
- 2931 Remington Way
- 2168 Pettigrew Dr
- 2689 Vista Verde Dr
- 2897 Moss Hollow Dr Unit 2897
- 2126 Mendota Way
- 2195 Cunningham Ct
- 2883 Flint Ave
- 1812 Home Gate Dr
- 3211 Pentland Ct
- 3286 Dias Dr
- 2647 Aida Ave
- 3248 Rocky Water Ln
- 1860 Home Gate Dr
- 2687 Glen Fenton Way
- 2535 Scottsdale Dr
- 2531 Scottsdale Dr
- 2694 Glen Doon Ct
- 2683 Glen Fenton Way
- 2690 Glen Doon Ct
- 2527 Scottsdale Dr
- 2692 Glen Fenton Way
- 2688 Glen Fenton Way
- 2696 Glen Fenton Way
- 2684 Glen Doon Ct
- 2679 Glen Fenton Way
- 2684 Glen Fenton Way
- 2523 Scottsdale Dr
- 2691 Glen Doon Ct
- 2680 Glen Fenton Way
- 2701 Glen Amador Ct
- 2680 Glen Doon Ct
- 2675 Glen Fenton Way
- 2519 Scottsdale Dr