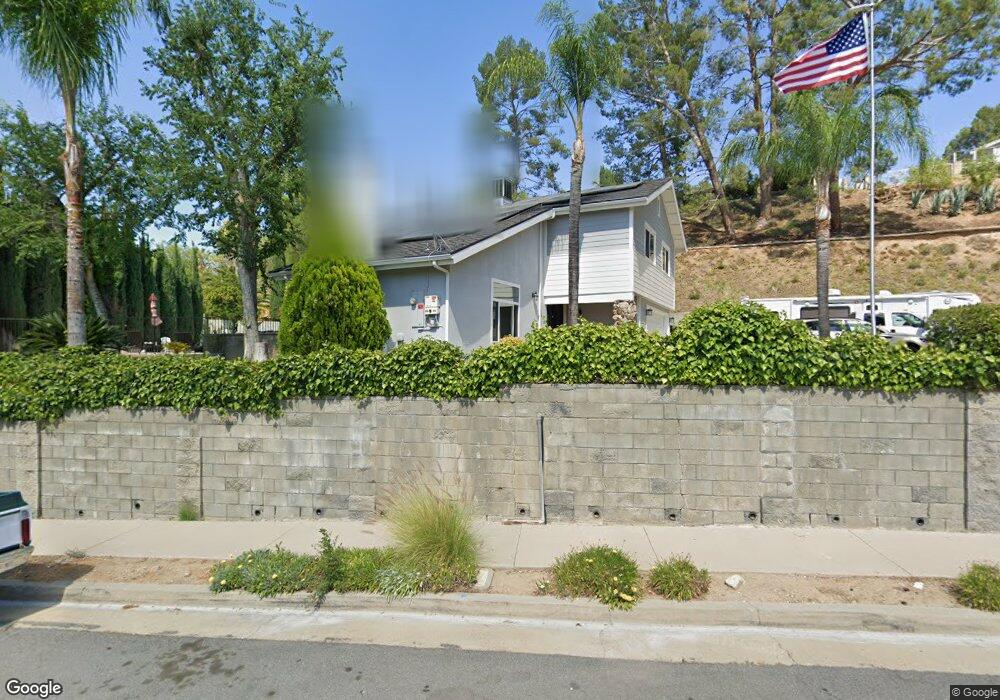
26916 Barbacoa Place Santa Clarita, CA 91350
Saugus NeighborhoodEstimated Value: $905,000 - $1,008,233
4
Beds
3
Baths
2,072
Sq Ft
$452/Sq Ft
Est. Value
About This Home
This home is located at 26916 Barbacoa Place, Santa Clarita, CA 91350 and is currently estimated at $936,558, approximately $452 per square foot. 26916 Barbacoa Place is a home located in Los Angeles County with nearby schools including Highlands Elementary School, Arroyo Seco Junior High School, and Saugus High School.
Ownership History
Date
Name
Owned For
Owner Type
Purchase Details
Closed on
Mar 3, 2023
Sold by
Annecharico Denton D and Annecharico Margaret A
Bought by
Annecharico Family Trust
Current Estimated Value
Purchase Details
Closed on
Oct 9, 2015
Sold by
Annecharico Denton D and Tracy Margaret A
Bought by
Tracy Margaret A and Annecharico Denton D
Home Financials for this Owner
Home Financials are based on the most recent Mortgage that was taken out on this home.
Original Mortgage
$385,100
Interest Rate
3.86%
Mortgage Type
New Conventional
Purchase Details
Closed on
Apr 6, 2009
Sold by
Piersma Randall and Piersma Bonnie
Bought by
Annecharico Denton and Tracy Margaret
Home Financials for this Owner
Home Financials are based on the most recent Mortgage that was taken out on this home.
Original Mortgage
$320,000
Interest Rate
4.71%
Mortgage Type
Purchase Money Mortgage
Create a Home Valuation Report for This Property
The Home Valuation Report is an in-depth analysis detailing your home's value as well as a comparison with similar homes in the area
Home Values in the Area
Average Home Value in this Area
Purchase History
| Date | Buyer | Sale Price | Title Company |
|---|---|---|---|
| Annecharico Family Trust | -- | None Listed On Document | |
| Tracy Margaret A | -- | Lawyers Title Sd | |
| Annecharico Denton | $470,000 | Lawyers Title |
Source: Public Records
Mortgage History
| Date | Status | Borrower | Loan Amount |
|---|---|---|---|
| Previous Owner | Tracy Margaret A | $385,100 | |
| Previous Owner | Annecharico Denton | $320,000 |
Source: Public Records
Tax History Compared to Growth
Tax History
| Year | Tax Paid | Tax Assessment Tax Assessment Total Assessment is a certain percentage of the fair market value that is determined by local assessors to be the total taxable value of land and additions on the property. | Land | Improvement |
|---|---|---|---|---|
| 2025 | $8,268 | $605,230 | $257,543 | $347,687 |
| 2024 | $8,268 | $593,364 | $252,494 | $340,870 |
| 2023 | $8,061 | $581,731 | $247,544 | $334,187 |
| 2022 | $8,098 | $570,326 | $242,691 | $327,635 |
| 2021 | $7,961 | $559,144 | $237,933 | $321,211 |
| 2019 | $7,674 | $542,562 | $230,877 | $311,685 |
| 2018 | $7,377 | $531,924 | $226,350 | $305,574 |
| 2016 | $6,978 | $511,270 | $217,561 | $293,709 |
| 2015 | $6,720 | $503,592 | $214,294 | $289,298 |
| 2014 | $6,389 | $474,000 | $201,000 | $273,000 |
Source: Public Records
Map
Nearby Homes
- 22123 Alamogordo Rd
- 27231 Cabrera Ave
- 26724 Diaz Dr
- 26721 Diaz Dr
- 26927 Cuatro Milpas St
- 26953 Cuatro Milpas St
- 22500 Festividad Dr
- 22725 Garzota Dr
- 27021 Rio Bosque Dr
- 26861 Cuatro Milpas St
- 27215 Elias Ave
- 22810 Rio Chico Dr
- 22346 Cheraw Dr
- 27127 Rio Bosque Dr
- 22003 Caceras St
- 22903 Vista Delgado Dr
- 23132 Posada Dr
- 21983 Centurion Way
- 21827 Centurion Way
- 27619 Ron Ridge Dr
- 22268 Canones Cir
- 22262 Canones Cir
- 22323 Barbacoa Dr
- 22319 Barbacoa Dr
- 26917 Barbacoa Place
- 22274 Canones Cir
- 26909 Barbacoa Place
- 22311 Barbacoa Dr
- 22254 Canones Cir
- 26901 Barbacoa Place
- 26900 Barbacoa Place
- 22329 Barbacoa Dr
- 22301 Barbacoa Dr
- 22248 Canones Cir
- 22263 Barbacoa Dr
- 22263 Canones Cir
- 22288 Canones Cir
- 22333 Barbacoa Dr
- 22257 Barbacoa Dr
- 22281 Canones Cir