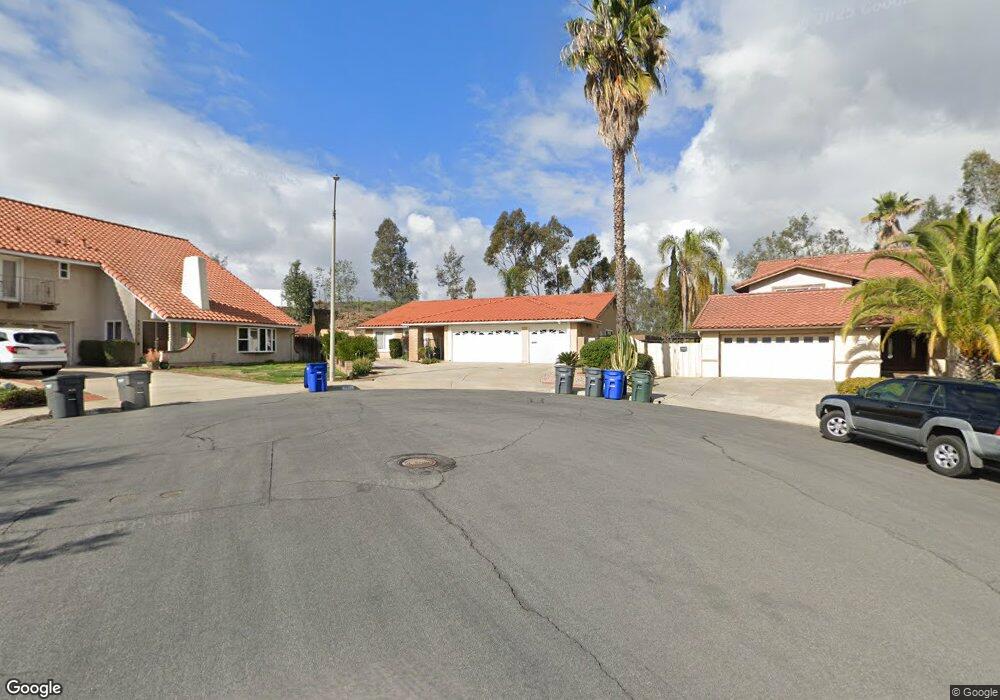
2692 Kildare Way El Cajon, CA 92020
Fletcher Hills NeighborhoodEstimated Value: $1,076,786 - $1,348,000
3
Beds
2
Baths
2,233
Sq Ft
$531/Sq Ft
Est. Value
About This Home
This home is located at 2692 Kildare Way, El Cajon, CA 92020 and is currently estimated at $1,184,697, approximately $530 per square foot. 2692 Kildare Way is a home located in San Diego County with nearby schools including Fletcher Hills Elementary School, Parkway Academy, and West Hills High School.
Ownership History
Date
Name
Owned For
Owner Type
Purchase Details
Closed on
May 30, 2019
Sold by
Johnson Ronald L and Johnson Jill J
Bought by
Johnson Chelsea
Current Estimated Value
Purchase Details
Closed on
Oct 13, 2010
Sold by
Mentzer Jewell L
Bought by
Johnson Chelsea and Johnson Ronald L
Purchase Details
Closed on
Oct 7, 1994
Sold by
Barratt American Inc
Bought by
Mentzer Duane and Mentzer Jewell
Home Financials for this Owner
Home Financials are based on the most recent Mortgage that was taken out on this home.
Original Mortgage
$165,600
Interest Rate
8.54%
Mortgage Type
Purchase Money Mortgage
Purchase Details
Closed on
Sep 15, 1994
Sold by
Ehlers Ronald L and Ehlers Joanne H
Bought by
Barratt American Inc
Home Financials for this Owner
Home Financials are based on the most recent Mortgage that was taken out on this home.
Original Mortgage
$165,600
Interest Rate
8.54%
Mortgage Type
Purchase Money Mortgage
Purchase Details
Closed on
Oct 10, 1989
Create a Home Valuation Report for This Property
The Home Valuation Report is an in-depth analysis detailing your home's value as well as a comparison with similar homes in the area
Home Values in the Area
Average Home Value in this Area
Purchase History
| Date | Buyer | Sale Price | Title Company |
|---|---|---|---|
| Johnson Chelsea | -- | None Available | |
| Johnson Chelsea | $500,000 | Lawyers Title | |
| Mentzer Duane | -- | First American Title Co | |
| Barratt American Inc | -- | First American Title Co | |
| -- | $259,900 | -- |
Source: Public Records
Mortgage History
| Date | Status | Borrower | Loan Amount |
|---|---|---|---|
| Previous Owner | Mentzer Duane | $165,600 | |
| Previous Owner | Barratt American Inc | $25,000 |
Source: Public Records
Tax History Compared to Growth
Tax History
| Year | Tax Paid | Tax Assessment Tax Assessment Total Assessment is a certain percentage of the fair market value that is determined by local assessors to be the total taxable value of land and additions on the property. | Land | Improvement |
|---|---|---|---|---|
| 2025 | $8,005 | $640,576 | $278,374 | $362,202 |
| 2024 | $8,005 | $628,016 | $272,916 | $355,100 |
| 2023 | $7,814 | $615,703 | $267,565 | $348,138 |
| 2022 | $7,582 | $603,631 | $262,319 | $341,312 |
| 2021 | $7,423 | $591,796 | $257,176 | $334,620 |
| 2020 | $7,159 | $585,728 | $254,539 | $331,189 |
| 2019 | $6,607 | $574,245 | $249,549 | $324,696 |
| 2018 | $6,469 | $562,986 | $244,656 | $318,330 |
| 2017 | $6,375 | $551,948 | $239,859 | $312,089 |
| 2016 | $6,166 | $541,126 | $235,156 | $305,970 |
| 2015 | $6,122 | $532,999 | $231,624 | $301,375 |
| 2014 | $5,998 | $522,559 | $227,087 | $295,472 |
Source: Public Records
Map
Nearby Homes
- 2524 Seattle Dr
- 2527 Gibbons St
- 9254 Lake Murray Blvd Unit B
- 9411 Lake Murray Blvd Unit B
- 8774 Tommy Dr
- 700 Wakefield Ct
- 2106 Windmill View Rd
- 2052 Flying Hills Ln
- 7622 Rainswept Ln Unit 134
- 6802 Maury Dr
- 7142 Bobhird Dr
- 0 Hacienda Dr
- 8735 Navajo Rd Unit 8
- 8767 Navajo Rd Unit 12
- 1951 Belmore Ct
- 2528 Windmill View Rd
- 8721 Lake Murray Blvd Unit 1
- 1958 Milford Place
- 8765 Lake Murray Blvd Unit 3
- 8765 Lake Murray Blvd Unit 11
- 2668 Kildare Way
- 2693 Kildare Way
- 2691 Trevor Place
- 2646 Kildare Way
- 2671 Kildare Way
- 1254 Pillsbury Ln
- 2659 Kildare Way
- 1278 Pillsbury Ln
- 2647 Kildare Way
- 2623 Kildare Way
- 2604 Kildare Way
- 2694 Trevor Place
- 1328 Pillsbury Ln
- 1233 Pillsbury Ln
- 2635 Kildare Way
- 1066 Nugent Ct
- 1084 Nugent Ct
- 1072 Nugent Ct
- 1255 Pillsbury Ln
- 2611 Kildare Way