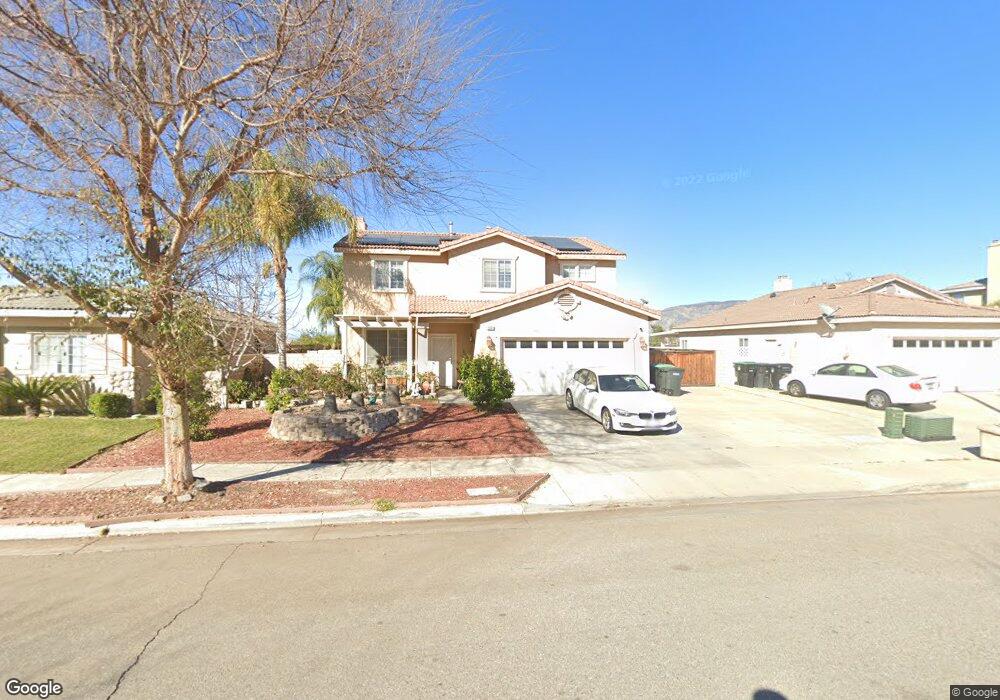
2694 Colby St Hemet, CA 92545
Equestrian Downs NeighborhoodEstimated Value: $486,665 - $516,000
4
Beds
3
Baths
2,065
Sq Ft
$241/Sq Ft
Est. Value
About This Home
This home is located at 2694 Colby St, Hemet, CA 92545 and is currently estimated at $496,666, approximately $240 per square foot. 2694 Colby St is a home located in Riverside County with nearby schools including Fruitvale Elementary School, Rancho Viejo Middle School, and Tahquitz High School.
Ownership History
Date
Name
Owned For
Owner Type
Purchase Details
Closed on
Nov 16, 2010
Sold by
Bac Home Loans Servicing Lp
Bought by
Parreno Mario Ayapana and Parreno Corazon Guevara
Current Estimated Value
Home Financials for this Owner
Home Financials are based on the most recent Mortgage that was taken out on this home.
Original Mortgage
$80,000
Outstanding Balance
$52,513
Interest Rate
4.17%
Mortgage Type
New Conventional
Estimated Equity
$444,153
Purchase Details
Closed on
Apr 9, 2010
Sold by
Pruett Joe and Pruett Cindy
Bought by
Bac Home Loans Servicing Lp and Countrywide Home Loans Servicing Lp
Purchase Details
Closed on
Oct 20, 2003
Sold by
Covenant/Oasis Hemet Llc
Bought by
Pruett Joe and Pruett Cindy
Home Financials for this Owner
Home Financials are based on the most recent Mortgage that was taken out on this home.
Original Mortgage
$204,300
Interest Rate
6.02%
Mortgage Type
Purchase Money Mortgage
Create a Home Valuation Report for This Property
The Home Valuation Report is an in-depth analysis detailing your home's value as well as a comparison with similar homes in the area
Home Values in the Area
Average Home Value in this Area
Purchase History
| Date | Buyer | Sale Price | Title Company |
|---|---|---|---|
| Parreno Mario Ayapana | $145,000 | Landsafe Title Of Ca Inc | |
| Bac Home Loans Servicing Lp | $137,250 | Landsafe Title | |
| Duetsche Bank National Trust Company | $137,250 | Landsafe Title | |
| Pruett Joe | $215,500 | Orange Coast Title Company |
Source: Public Records
Mortgage History
| Date | Status | Borrower | Loan Amount |
|---|---|---|---|
| Open | Parreno Mario Ayapana | $80,000 | |
| Previous Owner | Pruett Joe | $204,300 |
Source: Public Records
Tax History Compared to Growth
Tax History
| Year | Tax Paid | Tax Assessment Tax Assessment Total Assessment is a certain percentage of the fair market value that is determined by local assessors to be the total taxable value of land and additions on the property. | Land | Improvement |
|---|---|---|---|---|
| 2025 | $2,543 | $185,756 | $38,429 | $147,327 |
| 2023 | $2,543 | $178,545 | $36,938 | $141,607 |
| 2022 | $2,437 | $175,045 | $36,214 | $138,831 |
| 2021 | $2,385 | $171,613 | $35,504 | $136,109 |
| 2020 | $2,344 | $169,854 | $35,140 | $134,714 |
| 2019 | $2,288 | $166,524 | $34,451 | $132,073 |
| 2018 | $2,204 | $163,260 | $33,777 | $129,483 |
| 2017 | $2,165 | $160,060 | $33,115 | $126,945 |
| 2016 | $2,145 | $156,922 | $32,466 | $124,456 |
| 2015 | $2,128 | $154,567 | $31,979 | $122,588 |
| 2014 | $2,030 | $151,541 | $31,353 | $120,188 |
Source: Public Records
Map
Nearby Homes
- 1151 Tori Dr
- 1250 N Kirby St Unit 92
- 1250 N Kirby St Unit 151
- 1250 N Kirby St Unit 231
- 1250 N Kirby St Unit 132
- 1250 N Kirby St Unit 240
- 1250 N Kirby St Unit 55
- 1250 N Kirby St Unit 205
- 1250 N Kirby St Unit 138
- 1250 N Kirby St Unit 149
- 1250 N Kirby St Unit 32
- 1250 N Kirby St Unit 181
- 1250 N Kirby St Unit 127
- 1250 N Kirby St Unit 241
- 1250 N Kirby St Unit 226
- 1250 N Kirby St Unit 78
- 1250 N Kirby St Unit 114
- Residence 2 Plan at Kirby Estates
- Residence 1 Plan at Kirby Estates
- Residence 3 Plan at Kirby Estates