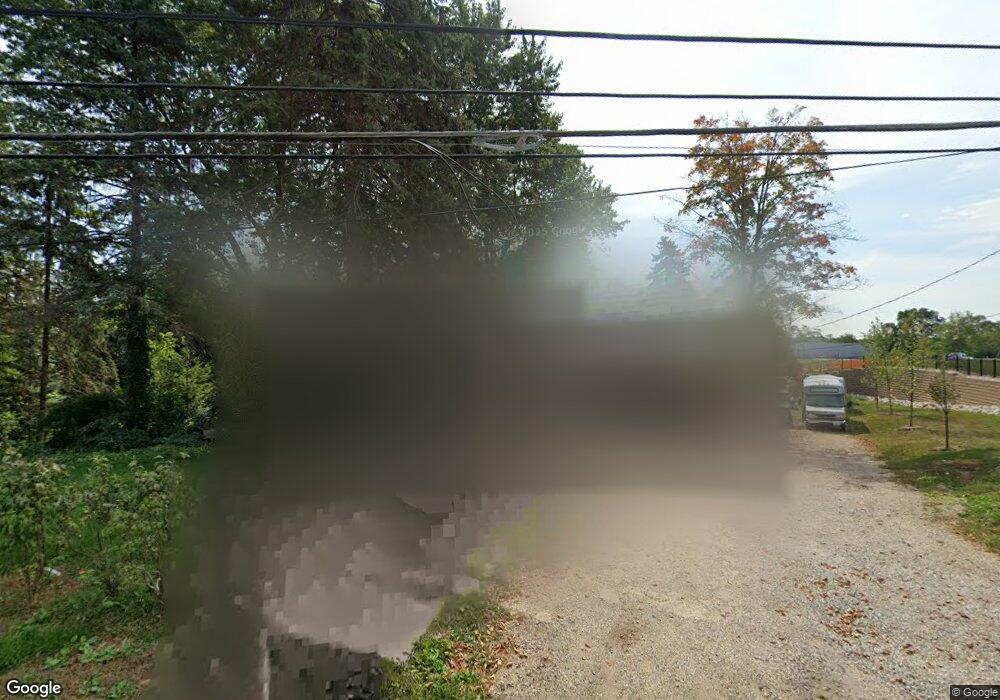
26W135 Plank Rd Naperville, IL 60563
North Naperville NeighborhoodEstimated Value: $417,000 - $499,395
3
Beds
2
Baths
1,008
Sq Ft
$447/Sq Ft
Est. Value
About This Home
This home is located at 26W135 Plank Rd, Naperville, IL 60563 and is currently estimated at $450,349, approximately $446 per square foot. 26W135 Plank Rd is a home located in DuPage County with nearby schools including Ellsworth Elementary School, Washington Jr High School, and Naperville North High School.
Ownership History
Date
Name
Owned For
Owner Type
Purchase Details
Closed on
Jun 26, 2001
Sold by
Vantellingen Dirk and Quick Cheryl Ruth
Bought by
Alexander Neal E and Alexander Charon J
Current Estimated Value
Home Financials for this Owner
Home Financials are based on the most recent Mortgage that was taken out on this home.
Original Mortgage
$152,800
Outstanding Balance
$59,441
Interest Rate
7.27%
Estimated Equity
$390,908
Purchase Details
Closed on
May 25, 2001
Sold by
Ecker Mark R and Ecker Cathy S
Bought by
Vantellingen Dirk A and Quick Cheryl R
Home Financials for this Owner
Home Financials are based on the most recent Mortgage that was taken out on this home.
Original Mortgage
$152,800
Outstanding Balance
$59,441
Interest Rate
7.27%
Estimated Equity
$390,908
Purchase Details
Closed on
Jul 31, 1995
Sold by
Stout John E and Stout Laurie M
Bought by
Ecker Mark R and Ecker Cathy Stagg
Home Financials for this Owner
Home Financials are based on the most recent Mortgage that was taken out on this home.
Original Mortgage
$108,000
Interest Rate
7.51%
Create a Home Valuation Report for This Property
The Home Valuation Report is an in-depth analysis detailing your home's value as well as a comparison with similar homes in the area
Home Values in the Area
Average Home Value in this Area
Purchase History
| Date | Buyer | Sale Price | Title Company |
|---|---|---|---|
| Alexander Neal E | -- | First American Title | |
| Vantellingen Dirk A | $190,000 | -- | |
| Ecker Mark R | $98,000 | First American Title |
Source: Public Records
Mortgage History
| Date | Status | Borrower | Loan Amount |
|---|---|---|---|
| Open | Alexander Neal E | $152,800 | |
| Previous Owner | Ecker Mark R | $108,000 |
Source: Public Records
Tax History
| Year | Tax Paid | Tax Assessment Tax Assessment Total Assessment is a certain percentage of the fair market value that is determined by local assessors to be the total taxable value of land and additions on the property. | Land | Improvement |
|---|---|---|---|---|
| 2024 | $7,433 | $135,462 | $100,695 | $34,767 |
| 2023 | $7,144 | $123,630 | $91,900 | $31,730 |
| 2022 | $6,860 | $117,740 | $87,520 | $30,220 |
| 2021 | $6,580 | $113,290 | $84,210 | $29,080 |
| 2020 | $6,429 | $111,260 | $82,700 | $28,560 |
| 2019 | $6,252 | $106,440 | $79,120 | $27,320 |
| 2018 | $6,268 | $106,440 | $79,120 | $27,320 |
| 2017 | $6,153 | $102,850 | $76,450 | $26,400 |
| 2016 | $6,020 | $99,140 | $73,690 | $25,450 |
| 2015 | $5,795 | $90,740 | $69,390 | $21,350 |
| 2014 | $6,072 | $92,600 | $70,810 | $21,790 |
| 2013 | $5,991 | $92,820 | $70,980 | $21,840 |
Source: Public Records
Map
Nearby Homes
- 941 Coletta Cir
- 906 Coletta Cir
- 825 Biltmore Ct
- 634 E 5th Ave
- 596 Windham Ln
- 340 N Wright St
- 5S661 Wright St
- 930 N Loomis St
- 837 N Loomis St
- 952 N Loomis St
- 636 E 4th Ave
- 26W250 Case St
- 421 E School St
- 24 S Huffman St
- 715 N Brainard St
- 717 N Brainard St
- 719 N Brainard St
- 809 N Brainard St
- 5 N Columbia St
- 509 N Brainard St
- 26W235 Plank Rd
- 949 Coletta Cir
- 947 Coletta Cir
- 945 Coletta Cir
- 943 Coletta Cir
- 573 Plank Rd
- 7004 Coletta Cir
- 7003 Coletta Cir
- 939 Coletta Cir
- 565 Plank Rd
- 581 Plank Rd
- 948 Coletta Cir
- 937 Coletta Cir
- 935 Coletta Cir
- 938 Coletta Cir
- 946 Coletta Cir
- 946 Coletta Cir Unit 5-4
- 944 Coletta Cir
- 942 Coletta Cir Unit 5-2
- 933 Coletta Cir
Your Personal Tour Guide
Ask me questions while you tour the home.