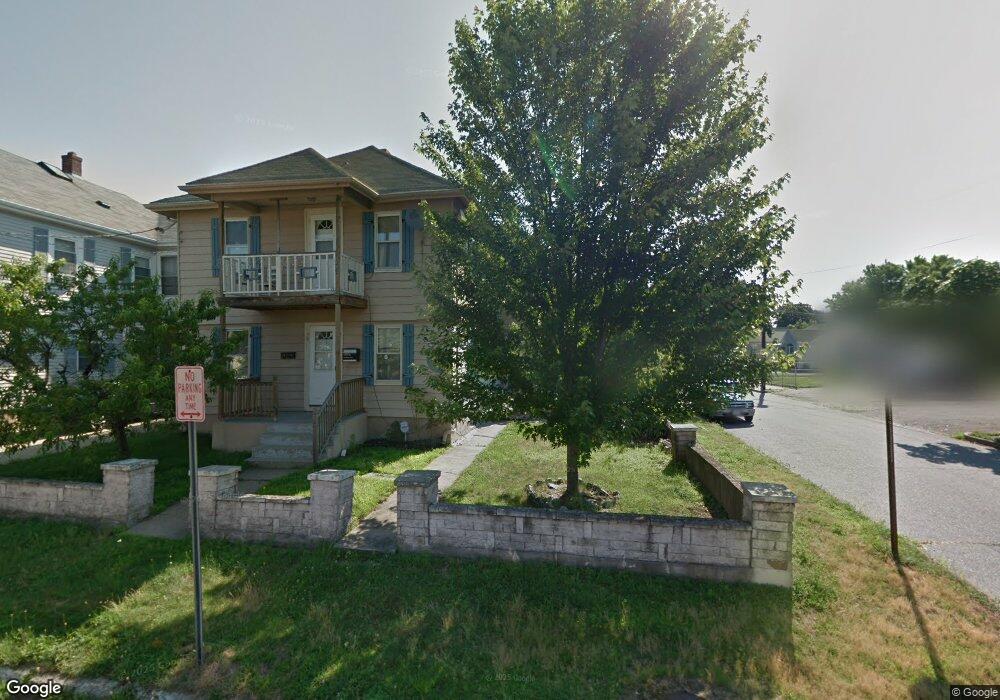
27 Chase St Pawtucket, RI 02861
Darlington NeighborhoodEstimated Value: $427,000 - $583,000
6
Beds
2
Baths
1,984
Sq Ft
$256/Sq Ft
Est. Value
About This Home
This home is located at 27 Chase St, Pawtucket, RI 02861 and is currently estimated at $507,070, approximately $255 per square foot. 27 Chase St is a home located in Providence County with nearby schools including St Cecilia School and Dayspring Christian Academy.
Ownership History
Date
Name
Owned For
Owner Type
Purchase Details
Closed on
Jun 1, 2011
Sold by
Hsbc Bank Usa Na
Bought by
Montgomery and Burns
Current Estimated Value
Home Financials for this Owner
Home Financials are based on the most recent Mortgage that was taken out on this home.
Original Mortgage
$92,000
Interest Rate
4.85%
Mortgage Type
Purchase Money Mortgage
Purchase Details
Closed on
Apr 19, 2011
Sold by
Lopez Maribel
Bought by
Hsbc Bank Usa
Home Financials for this Owner
Home Financials are based on the most recent Mortgage that was taken out on this home.
Original Mortgage
$92,000
Interest Rate
4.85%
Mortgage Type
Purchase Money Mortgage
Purchase Details
Closed on
Nov 1, 2006
Sold by
Mauricio Rene and Arguello Lisa
Bought by
Lopez Maribel
Create a Home Valuation Report for This Property
The Home Valuation Report is an in-depth analysis detailing your home's value as well as a comparison with similar homes in the area
Home Values in the Area
Average Home Value in this Area
Purchase History
| Date | Buyer | Sale Price | Title Company |
|---|---|---|---|
| Montgomery | $102,500 | -- | |
| Hsbc Bank Usa | $140,250 | -- | |
| Lopez Maribel | $290,000 | -- |
Source: Public Records
Mortgage History
| Date | Status | Borrower | Loan Amount |
|---|---|---|---|
| Open | Lopez Maribel | $122,735 | |
| Closed | Lopez Maribel | $16,323 | |
| Closed | Lopez Maribel | $92,000 |
Source: Public Records
Tax History
| Year | Tax Paid | Tax Assessment Tax Assessment Total Assessment is a certain percentage of the fair market value that is determined by local assessors to be the total taxable value of land and additions on the property. | Land | Improvement |
|---|---|---|---|---|
| 2025 | $5,854 | $445,200 | $154,700 | $290,500 |
| 2024 | $5,494 | $445,200 | $154,700 | $290,500 |
| 2023 | $4,681 | $276,300 | $70,800 | $205,500 |
| 2022 | $4,581 | $276,300 | $70,800 | $205,500 |
| 2021 | $4,581 | $276,300 | $70,800 | $205,500 |
| 2020 | $3,871 | $185,300 | $64,000 | $121,300 |
| 2019 | $3,871 | $185,300 | $64,000 | $121,300 |
| 2018 | $3,706 | $184,100 | $64,000 | $120,100 |
| 2017 | $3,231 | $142,200 | $49,700 | $92,500 |
| 2016 | $3,113 | $142,200 | $49,700 | $92,500 |
| 2015 | $3,113 | $142,200 | $49,700 | $92,500 |
| 2014 | $3,092 | $134,100 | $49,700 | $84,400 |
Source: Public Records
Map
Nearby Homes
Your Personal Tour Guide
Ask me questions while you tour the home.